

296
M. Méndez and T. M. Belloni
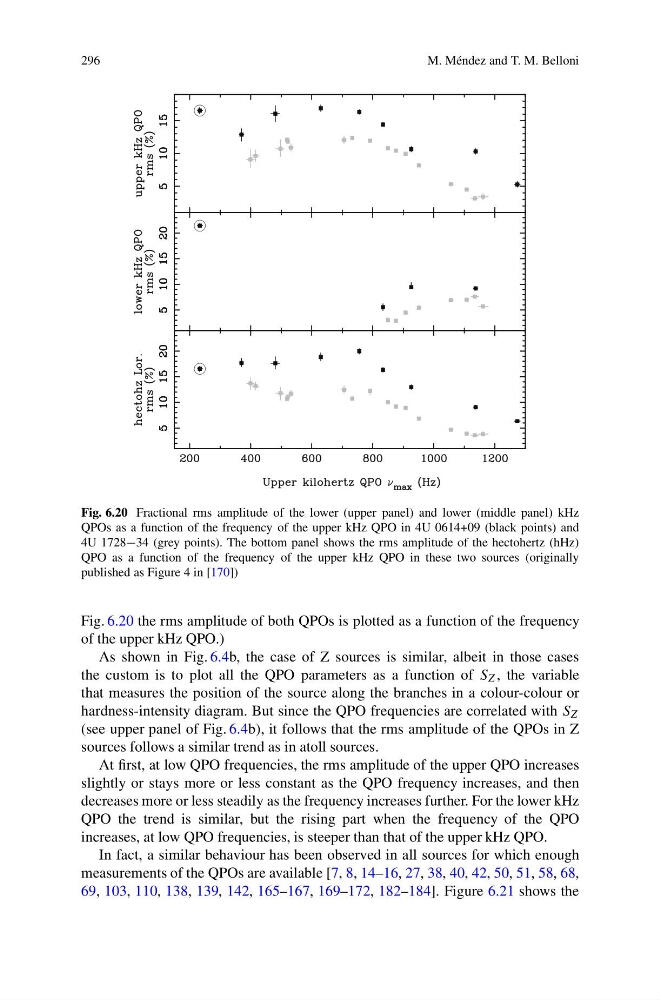
Fig. 6.20 Fractional rms amplitude of the lower (upper panel) and lower (middle panel) kHz
QPOs as a function of the frequency of the upper kHz QPO in 4U 0614+09 (black points) and
4U 1728−34 (grey points). The bottom panel shows the rms amplitude of the hectohertz (hHz)
QPO as a function of the frequency of the upper kHz QPO in these two sources (originally
published as Figure 4 in [170])
Fig. 6.20 the rms amplitude of both QPOs is plotted as a function of the frequency
of the upper kHz QPO.)
As shown in Fig. 6.4b, the case of Z sources is similar, albeit in those cases
the custom is to plot all the QPO parameters as a function of S Z , the variable
that measures the position of the source along the branches in a colour-colour or
hardness-intensity diagram. But since the QPO frequencies are correlated with S Z
(see upper panel of Fig. 6.4b), it follows that the rms amplitude of the QPOs in Z
sources follows a similar trend as in atoll sources.
At first, at low QPO frequencies, the rms amplitude of the upper QPO increases
slightly or stays more or less constant as the QPO frequency increases, and then
decreases more or less steadily as the frequency increases further. For the lower kHz
QPO the trend is similar, but the rising part when the frequency of the QPO
increases, at low QPO frequencies, is steeper than that of the upper kHz QPO.
In fact, a similar behaviour has been observed in all sources for which enough
measurements of the QPOs are available [7, 8, 14–16, 27, 38, 40, 42, 50, 51, 58, 68,
69, 103, 110, 138, 139, 142, 165–167, 169–172, 182–184]. Figure 6.21 shows the
M. Méndez and T. M. Belloni
Fig. 6.20 Fractional rms amplitude of the lower (upper panel) and lower (middle panel) kHz
QPOs as a function of the frequency of the upper kHz QPO in 4U 0614+09 (black points) and
4U 1728−34 (grey points). The bottom panel shows the rms amplitude of the hectohertz (hHz)
QPO as a function of the frequency of the upper kHz QPO in these two sources (originally
published as Figure 4 in [170])
Fig. 6.20 the rms amplitude of both QPOs is plotted as a function of the frequency
of the upper kHz QPO.)
As shown in Fig. 6.4b, the case of Z sources is similar, albeit in those cases
the custom is to plot all the QPO parameters as a function of S Z , the variable
that measures the position of the source along the branches in a colour-colour or
hardness-intensity diagram. But since the QPO frequencies are correlated with S Z
(see upper panel of Fig. 6.4b), it follows that the rms amplitude of the QPOs in Z
sources follows a similar trend as in atoll sources.
At first, at low QPO frequencies, the rms amplitude of the upper QPO increases
slightly or stays more or less constant as the QPO frequency increases, and then
decreases more or less steadily as the frequency increases further. For the lower kHz
QPO the trend is similar, but the rising part when the frequency of the QPO
increases, at low QPO frequencies, is steeper than that of the upper kHz QPO.
In fact, a similar behaviour has been observed in all sources for which enough
measurements of the QPOs are available [7, 8, 14–16, 27, 38, 40, 42, 50, 51, 58, 68,
69, 103, 110, 138, 139, 142, 165–167, 169–172, 182–184]. Figure 6.21 shows the