

6 High-Frequency Variability in Neutron-Star Low-Mass X-ray Binaries
295
400
500
600
700
800
900 1000 1100 1200 1300
−0.8
−0.4
0
0.4
0.8
1.2
1.6
Slope (%/keV)
Frequency (Hz)
All energies
Upper kHz QPO
Lower kHz QPO
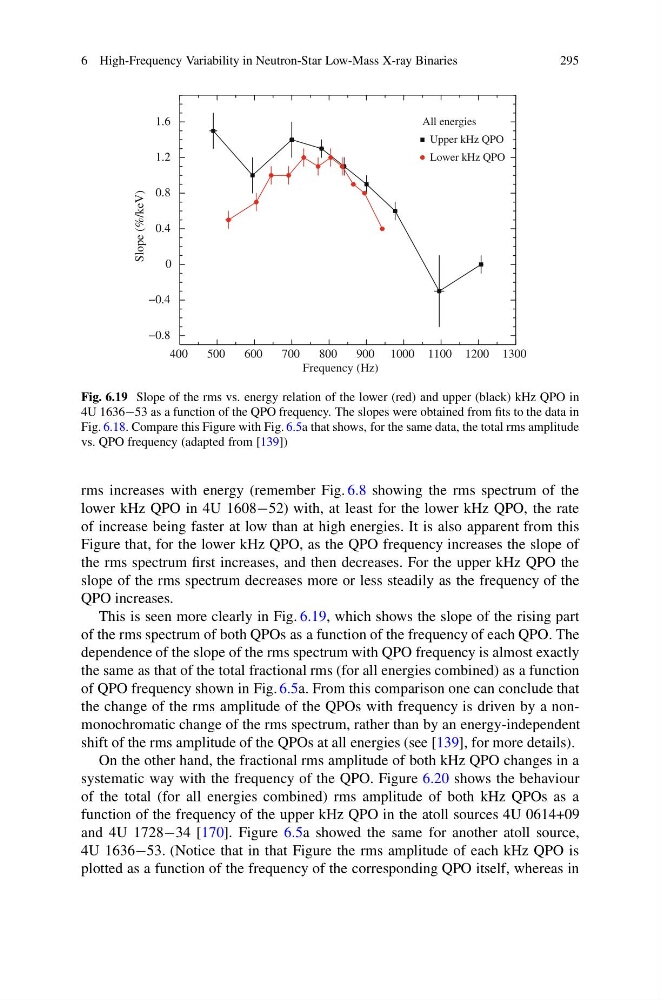
Fig. 6.19 Slope of the rms vs. energy relation of the lower (red) and upper (black) kHz QPO in
4U 1636−53 as a function of the QPO frequency. The slopes were obtained from fits to the data in
Fig. 6.18. Compare this Figure with Fig. 6.5a that shows, for the same data, the total rms amplitude
vs. QPO frequency (adapted from [139])
rms increases with energy (remember Fig. 6.8 showing the rms spectrum of the
lower kHz QPO in 4U 1608−52) with, at least for the lower kHz QPO, the rate
of increase being faster at low than at high energies. It is also apparent from this
Figure that, for the lower kHz QPO, as the QPO frequency increases the slope of
the rms spectrum first increases, and then decreases. For the upper kHz QPO the
slope of the rms spectrum decreases more or less steadily as the frequency of the
QPO increases.
This is seen more clearly in Fig. 6.19, which shows the slope of the rising part
of the rms spectrum of both QPOs as a function of the frequency of each QPO. The
dependence of the slope of the rms spectrum with QPO frequency is almost exactly
the same as that of the total fractional rms (for all energies combined) as a function
of QPO frequency shown in Fig. 6.5a. From this comparison one can conclude that
the change of the rms amplitude of the QPOs with frequency is driven by a nonmonochromatic change of the rms spectrum, rather than by an energy-independent
shift of the rms amplitude of the QPOs at all energies (see [139], for more details).
On the other hand, the fractional rms amplitude of both kHz QPO changes in a
systematic way with the frequency of the QPO. Figure 6.20 shows the behaviour
of the total (for all energies combined) rms amplitude of both kHz QPOs as a
function of the frequency of the upper kHz QPO in the atoll sources 4U 0614+09
and 4U 1728−34 [170]. Figure 6.5a showed the same for another atoll source,
4U 1636−53. (Notice that in that Figure the rms amplitude of each kHz QPO is
plotted as a function of the frequency of the corresponding QPO itself, whereas in
295
400
500
600
700
800
900 1000 1100 1200 1300
−0.8
−0.4
0
0.4
0.8
1.2
1.6
Slope (%/keV)
Frequency (Hz)
All energies
Upper kHz QPO
Lower kHz QPO
Fig. 6.19 Slope of the rms vs. energy relation of the lower (red) and upper (black) kHz QPO in
4U 1636−53 as a function of the QPO frequency. The slopes were obtained from fits to the data in
Fig. 6.18. Compare this Figure with Fig. 6.5a that shows, for the same data, the total rms amplitude
vs. QPO frequency (adapted from [139])
rms increases with energy (remember Fig. 6.8 showing the rms spectrum of the
lower kHz QPO in 4U 1608−52) with, at least for the lower kHz QPO, the rate
of increase being faster at low than at high energies. It is also apparent from this
Figure that, for the lower kHz QPO, as the QPO frequency increases the slope of
the rms spectrum first increases, and then decreases. For the upper kHz QPO the
slope of the rms spectrum decreases more or less steadily as the frequency of the
QPO increases.
This is seen more clearly in Fig. 6.19, which shows the slope of the rising part
of the rms spectrum of both QPOs as a function of the frequency of each QPO. The
dependence of the slope of the rms spectrum with QPO frequency is almost exactly
the same as that of the total fractional rms (for all energies combined) as a function
of QPO frequency shown in Fig. 6.5a. From this comparison one can conclude that
the change of the rms amplitude of the QPOs with frequency is driven by a nonmonochromatic change of the rms spectrum, rather than by an energy-independent
shift of the rms amplitude of the QPOs at all energies (see [139], for more details).
On the other hand, the fractional rms amplitude of both kHz QPO changes in a
systematic way with the frequency of the QPO. Figure 6.20 shows the behaviour
of the total (for all energies combined) rms amplitude of both kHz QPOs as a
function of the frequency of the upper kHz QPO in the atoll sources 4U 0614+09
and 4U 1728−34 [170]. Figure 6.5a showed the same for another atoll source,
4U 1636−53. (Notice that in that Figure the rms amplitude of each kHz QPO is
plotted as a function of the frequency of the corresponding QPO itself, whereas in