

288
M. Méndez and T. M. Belloni
spin
# of occurrences
0
1
2
3
# of occurrences
0
10
20
30
(Hz)
100
200
300
400
500
600
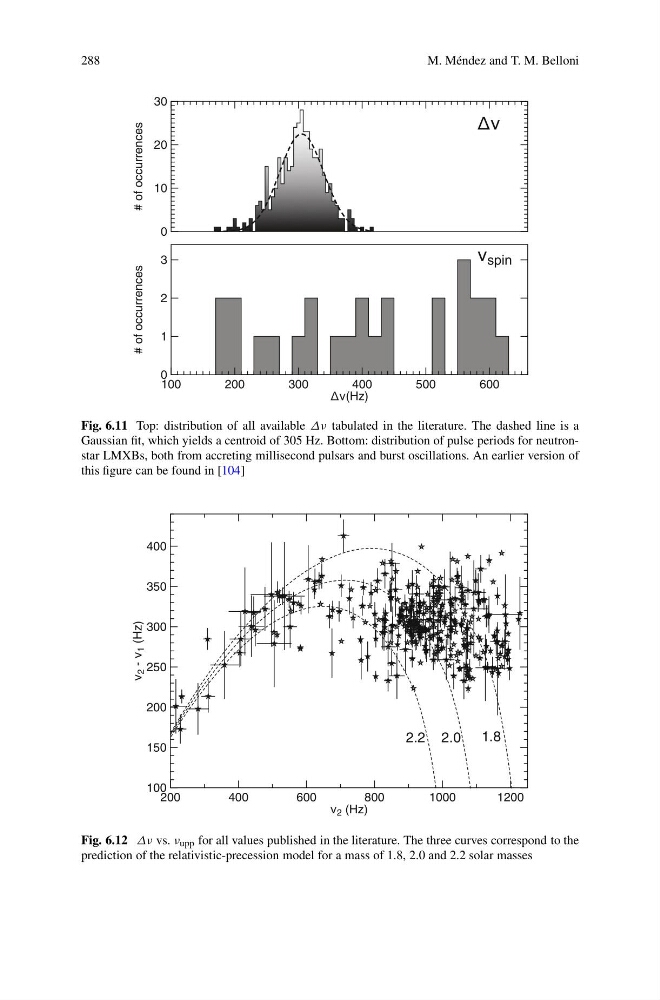
Fig. 6.11 Top: distribution of all available Δν tabulated in the literature. The dashed line is a
Gaussian fit, which yields a centroid of 305 Hz. Bottom: distribution of pulse periods for neutronstar LMXBs, both from accreting millisecond pulsars and burst oscillations. An earlier version of
this figure can be found in [104]
1.8
2.0
2.2
2 -
1 (Hz)
100
150
200
250
300
350
400
2 (Hz)
200
400
600
800
1000
1200
Fig. 6.12 Δν vs. ν upp for all values published in the literature. The three curves correspond to the
prediction of the relativistic-precession model for a mass of 1.8, 2.0 and 2.2 solar masses
M. Méndez and T. M. Belloni
spin
# of occurrences
0
1
2
3
# of occurrences
0
10
20
30
(Hz)
100
200
300
400
500
600
Fig. 6.11 Top: distribution of all available Δν tabulated in the literature. The dashed line is a
Gaussian fit, which yields a centroid of 305 Hz. Bottom: distribution of pulse periods for neutronstar LMXBs, both from accreting millisecond pulsars and burst oscillations. An earlier version of
this figure can be found in [104]
1.8
2.0
2.2
2 -
1 (Hz)
100
150
200
250
300
350
400
2 (Hz)
200
400
600
800
1000
1200
Fig. 6.12 Δν vs. ν upp for all values published in the literature. The three curves correspond to the
prediction of the relativistic-precession model for a mass of 1.8, 2.0 and 2.2 solar masses