

6 High-Frequency Variability in Neutron-Star Low-Mass X-ray Binaries
287
/
spin
0.2
0.4
0.6
0.8
1.0
1.2
1.4
1.6
1.8
2.0
spin (Hz)
200
300
400
500
600
700
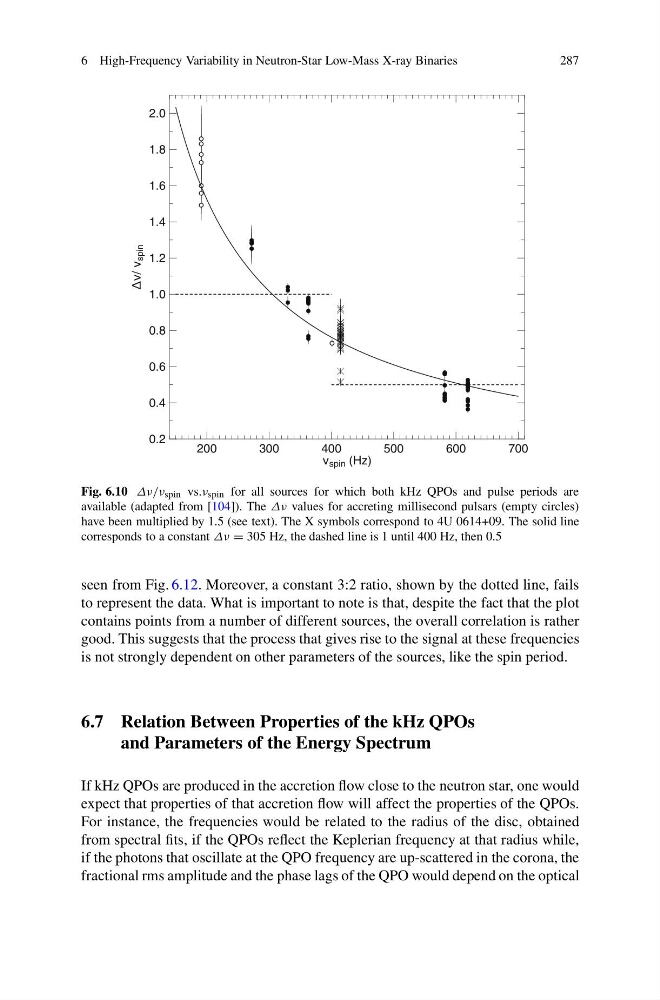
Fig. 6.10 Δν/ν spin vs.ν spin for all sources for which both kHz QPOs and pulse periods are
available (adapted from [104]). The Δν values for accreting millisecond pulsars (empty circles)
have been multiplied by 1.5 (see text). The X symbols correspond to 4U 0614+09. The solid line
corresponds to a constant Δν = 305 Hz, the dashed line is 1 until 400 Hz, then 0.5
seen from Fig. 6.12. Moreover, a constant 3:2 ratio, shown by the dotted line, fails
to represent the data. What is important to note is that, despite the fact that the plot
contains points from a number of different sources, the overall correlation is rather
good. This suggests that the process that gives rise to the signal at these frequencies
is not strongly dependent on other parameters of the sources, like the spin period.
6.7 Relation Between Properties of the kHz QPOs
and Parameters of the Energy Spectrum
If kHz QPOs are produced in the accretion flow close to the neutron star, one would
expect that properties of that accretion flow will affect the properties of the QPOs.
For instance, the frequencies would be related to the radius of the disc, obtained
from spectral fits, if the QPOs reflect the Keplerian frequency at that radius while,
if the photons that oscillate at the QPO frequency are up-scattered in the corona, the
fractional rms amplitude and the phase lags of the QPO would depend on the optical
287
/
spin
0.2
0.4
0.6
0.8
1.0
1.2
1.4
1.6
1.8
2.0
spin (Hz)
200
300
400
500
600
700
Fig. 6.10 Δν/ν spin vs.ν spin for all sources for which both kHz QPOs and pulse periods are
available (adapted from [104]). The Δν values for accreting millisecond pulsars (empty circles)
have been multiplied by 1.5 (see text). The X symbols correspond to 4U 0614+09. The solid line
corresponds to a constant Δν = 305 Hz, the dashed line is 1 until 400 Hz, then 0.5
seen from Fig. 6.12. Moreover, a constant 3:2 ratio, shown by the dotted line, fails
to represent the data. What is important to note is that, despite the fact that the plot
contains points from a number of different sources, the overall correlation is rather
good. This suggests that the process that gives rise to the signal at these frequencies
is not strongly dependent on other parameters of the sources, like the spin period.
6.7 Relation Between Properties of the kHz QPOs
and Parameters of the Energy Spectrum
If kHz QPOs are produced in the accretion flow close to the neutron star, one would
expect that properties of that accretion flow will affect the properties of the QPOs.
For instance, the frequencies would be related to the radius of the disc, obtained
from spectral fits, if the QPOs reflect the Keplerian frequency at that radius while,
if the photons that oscillate at the QPO frequency are up-scattered in the corona, the
fractional rms amplitude and the phase lags of the QPO would depend on the optical