

6 High-Frequency Variability in Neutron-Star Low-Mass X-ray Binaries
279
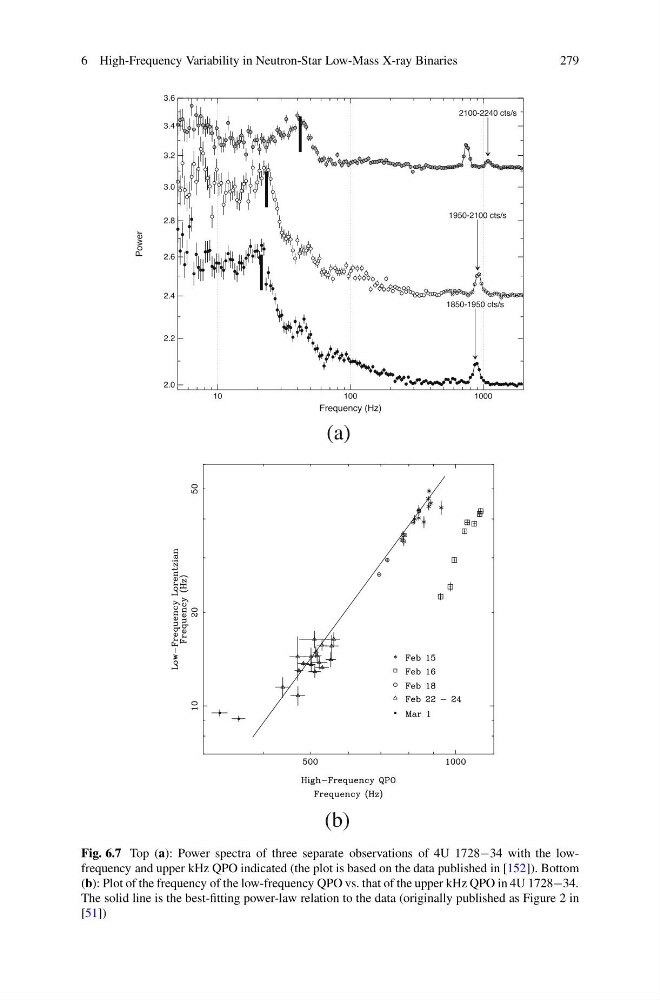
Fig. 6.7 Top (a): Power spectra of three separate observations of 4U 1728−34 with the lowfrequency and upper kHz QPO indicated (the plot is based on the data published in [152]). Bottom
(b): Plot of the frequency of the low-frequency QPO vs. that of the upper kHz QPO in 4U 1728−34.
The solid line is the best-fitting power-law relation to the data (originally published as Figure 2 in
[51])
279
Fig. 6.7 Top (a): Power spectra of three separate observations of 4U 1728−34 with the lowfrequency and upper kHz QPO indicated (the plot is based on the data published in [152]). Bottom
(b): Plot of the frequency of the low-frequency QPO vs. that of the upper kHz QPO in 4U 1728−34.
The solid line is the best-fitting power-law relation to the data (originally published as Figure 2 in
[51])