

278
M. Méndez and T. M. Belloni
0
100
200
300
400
500
200
400
600
800
1000
1200
Δν (Hz)
ν
0
u (Hz)
PBK99
Cir X-1
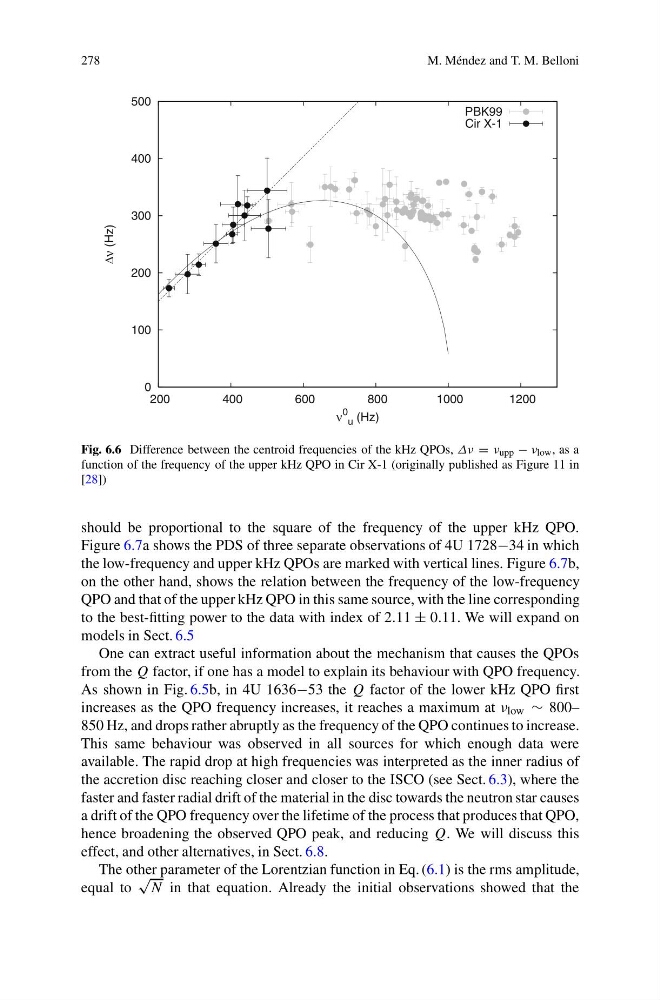
Fig. 6.6 Difference between the centroid frequencies of the kHz QPOs, Δν = ν upp − ν low , as a
function of the frequency of the upper kHz QPO in Cir X-1 (originally published as Figure 11 in
[28])
should be proportional to the square of the frequency of the upper kHz QPO.
Figure 6.7a shows the PDS of three separate observations of 4U 1728−34 in which
the low-frequency and upper kHz QPOs are marked with vertical lines. Figure 6.7b,
on the other hand, shows the relation between the frequency of the low-frequency
QPO and that of the upper kHz QPO in this same source, with the line corresponding
to the best-fitting power to the data with index of 2.11 ± 0.11. We will expand on
models in Sect. 6.5
One can extract useful information about the mechanism that causes the QPOs
from the Q factor, if one has a model to explain its behaviour with QPO frequency.
As shown in Fig. 6.5b, in 4U 1636−53 the Q factor of the lower kHz QPO first
increases as the QPO frequency increases, it reaches a maximum at ν low ∼ 800–
850 Hz, and drops rather abruptly as the frequency of the QPO continues to increase.
This same behaviour was observed in all sources for which enough data were
available. The rapid drop at high frequencies was interpreted as the inner radius of
the accretion disc reaching closer and closer to the ISCO (see Sect. 6.3), where the
faster and faster radial drift of the material in the disc towards the neutron star causes
a drift of the QPO frequency over the lifetime of the process that produces that QPO,
hence broadening the observed QPO peak, and reducing Q. We will discuss this
effect, and other alternatives, in Sect. 6.8.
The other parameter of the Lorentzian function in Eq. (6.1) is the rms amplitude,
equal to
√
N in that equation. Already the initial observations showed that the
M. Méndez and T. M. Belloni
0
100
200
300
400
500
200
400
600
800
1000
1200
Δν (Hz)
ν
0
u (Hz)
PBK99
Cir X-1
Fig. 6.6 Difference between the centroid frequencies of the kHz QPOs, Δν = ν upp − ν low , as a
function of the frequency of the upper kHz QPO in Cir X-1 (originally published as Figure 11 in
[28])
should be proportional to the square of the frequency of the upper kHz QPO.
Figure 6.7a shows the PDS of three separate observations of 4U 1728−34 in which
the low-frequency and upper kHz QPOs are marked with vertical lines. Figure 6.7b,
on the other hand, shows the relation between the frequency of the low-frequency
QPO and that of the upper kHz QPO in this same source, with the line corresponding
to the best-fitting power to the data with index of 2.11 ± 0.11. We will expand on
models in Sect. 6.5
One can extract useful information about the mechanism that causes the QPOs
from the Q factor, if one has a model to explain its behaviour with QPO frequency.
As shown in Fig. 6.5b, in 4U 1636−53 the Q factor of the lower kHz QPO first
increases as the QPO frequency increases, it reaches a maximum at ν low ∼ 800–
850 Hz, and drops rather abruptly as the frequency of the QPO continues to increase.
This same behaviour was observed in all sources for which enough data were
available. The rapid drop at high frequencies was interpreted as the inner radius of
the accretion disc reaching closer and closer to the ISCO (see Sect. 6.3), where the
faster and faster radial drift of the material in the disc towards the neutron star causes
a drift of the QPO frequency over the lifetime of the process that produces that QPO,
hence broadening the observed QPO peak, and reducing Q. We will discuss this
effect, and other alternatives, in Sect. 6.8.
The other parameter of the Lorentzian function in Eq. (6.1) is the rms amplitude,
equal to
√
N in that equation. Already the initial observations showed that the