

78
C. Juhong et al.
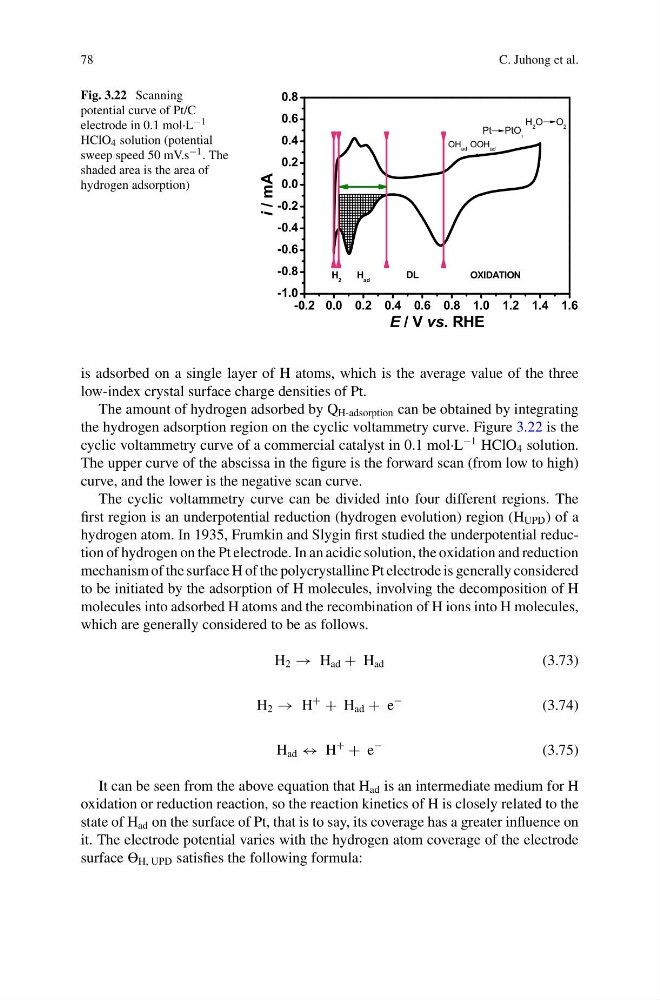
Fig. 3.22 Scanning
potential curve of Pt/C
electrode in 0.1 mol·L −1
HClO 4 solution (potential
sweep speed 50 mV.s −1 . The
shaded area is the area of
hydrogen adsorption)
-0.2 0.0 0.2 0.4 0.6 0.8 1.0 1.2 1.4 1.6
-1.0
-0.8
-0.6
-0.4
-0.2
0.0
0.2
0.4
0.6
0.8
i / mA
E / V vs. RHE
H 2
H ad
DL
Pt PtO x
OH ad OOH ad
H 2 O O 2
OXIDATION
is adsorbed on a single layer of H atoms, which is the average value of the three
low-index crystal surface charge densities of Pt.
The amount of hydrogen adsorbed by Q H-adsorption can be obtained by integrating
the hydrogen adsorption region on the cyclic voltammetry curve. Figure 3.22 is the
cyclic voltammetry curve of a commercial catalyst in 0.1 mol·L
−1 HClO 4 solution.
The upper curve of the abscissa in the figure is the forward scan (from low to high)
curve, and the lower is the negative scan curve.
The cyclic voltammetry curve can be divided into four different regions. The
first region is an underpotential reduction (hydrogen evolution) region (H UPD ) of a
hydrogen atom. In 1935, Frumkin and Slygin first studied the underpotential reduction of hydrogen on the Pt electrode. In an acidic solution, the oxidation and reduction
mechanism of the surface H of the polycrystalline Pt electrode is generally considered
to be initiated by the adsorption of H molecules, involving the decomposition of H
molecules into adsorbed H atoms and the recombination of H ions into H molecules,
which are generally considered to be as follows.
H 2 → H ad + H ad
(3.73)
H 2 → H
+
+ H ad + e
−
(3.74)
H ad ↔ H
+
+ e
−
(3.75)
It can be seen from the above equation that H ad is an intermediate medium for H
oxidation or reduction reaction, so the reaction kinetics of H is closely related to the
state of H ad on the surface of Pt, that is to say, its coverage has a greater influence on
it. The electrode potential varies with the hydrogen atom coverage of the electrode
surface º H, UPD satisfies the following formula:
C. Juhong et al.
Fig. 3.22 Scanning
potential curve of Pt/C
electrode in 0.1 mol·L −1
HClO 4 solution (potential
sweep speed 50 mV.s −1 . The
shaded area is the area of
hydrogen adsorption)
-0.2 0.0 0.2 0.4 0.6 0.8 1.0 1.2 1.4 1.6
-1.0
-0.8
-0.6
-0.4
-0.2
0.0
0.2
0.4
0.6
0.8
i / mA
E / V vs. RHE
H 2
H ad
DL
Pt PtO x
OH ad OOH ad
H 2 O O 2
OXIDATION
is adsorbed on a single layer of H atoms, which is the average value of the three
low-index crystal surface charge densities of Pt.
The amount of hydrogen adsorbed by Q H-adsorption can be obtained by integrating
the hydrogen adsorption region on the cyclic voltammetry curve. Figure 3.22 is the
cyclic voltammetry curve of a commercial catalyst in 0.1 mol·L
−1 HClO 4 solution.
The upper curve of the abscissa in the figure is the forward scan (from low to high)
curve, and the lower is the negative scan curve.
The cyclic voltammetry curve can be divided into four different regions. The
first region is an underpotential reduction (hydrogen evolution) region (H UPD ) of a
hydrogen atom. In 1935, Frumkin and Slygin first studied the underpotential reduction of hydrogen on the Pt electrode. In an acidic solution, the oxidation and reduction
mechanism of the surface H of the polycrystalline Pt electrode is generally considered
to be initiated by the adsorption of H molecules, involving the decomposition of H
molecules into adsorbed H atoms and the recombination of H ions into H molecules,
which are generally considered to be as follows.
H 2 → H ad + H ad
(3.73)
H 2 → H
+
+ H ad + e
−
(3.74)
H ad ↔ H
+
+ e
−
(3.75)
It can be seen from the above equation that H ad is an intermediate medium for H
oxidation or reduction reaction, so the reaction kinetics of H is closely related to the
state of H ad on the surface of Pt, that is to say, its coverage has a greater influence on
it. The electrode potential varies with the hydrogen atom coverage of the electrode
surface º H, UPD satisfies the following formula: