

3 The Measurements of the Oxygen Reduction Reaction
77
saturation coverage of CO on the Pt electrode is between 0.63 and 0.68 mL, and the
power density required for CO oxidation of the single layer of CO is 420 μC.cm
−2 .
The basic principle of characterizing the active area by the underpotential deposition of a single layer of Cu is similar to measuring the CO oxidative desorption. Here, the probe atom is Cu, and at the Nernst equilibrium potential, the probe
atom begins to deposit on the surface of the substrate. For the catalyst containing
metal Ru, the adsorption of CO and H on its surface is accompanied by a large
ion adsorption, resulting in a large error, and the adsorption of Cu does not have
this problem. However, the main disadvantage of this method is that the metal ions
strongly influence the reaction of the catalyst and are not conducive to the cleaning
of the electrolytic cell after the reaction.
The electrochemical specific surface area is calculated by the integrated electric
quantity of the hydrogen desorption zone. The biggest advantage is that this method
is simple and easy and can be directly obtained by integrating the CV curve. In the
following, metal platinum is taken as an example to discuss in detail how to calculate
the electrochemical specific surface area of the catalyst by measuring the integrated
electric quantity in the hydrogen desorption zone and give considerations for using
the method.
3.6.2 Integrated Power of Hydrogen Adsorption Zone
Different research teams have different selection tendencies in the choice of hydrogen
adsorption or desorption of electricity to characterize the active area. Theoretically,
the amount of hydrogen absorbed and desorbed should be the same, but the underpotential reduction of hydrogen easily causes the oxidation of hydrogen, which interferes with the amount of electricity in the hydrogen desorption zone. In addition,
setting the upper limit potential of different catalyst oxidation will affect the desorption peak of hydrogen. Considering these factors comprehensively, this paper adopts
the method of measuring the electricity in the hydrogen adsorption zone.
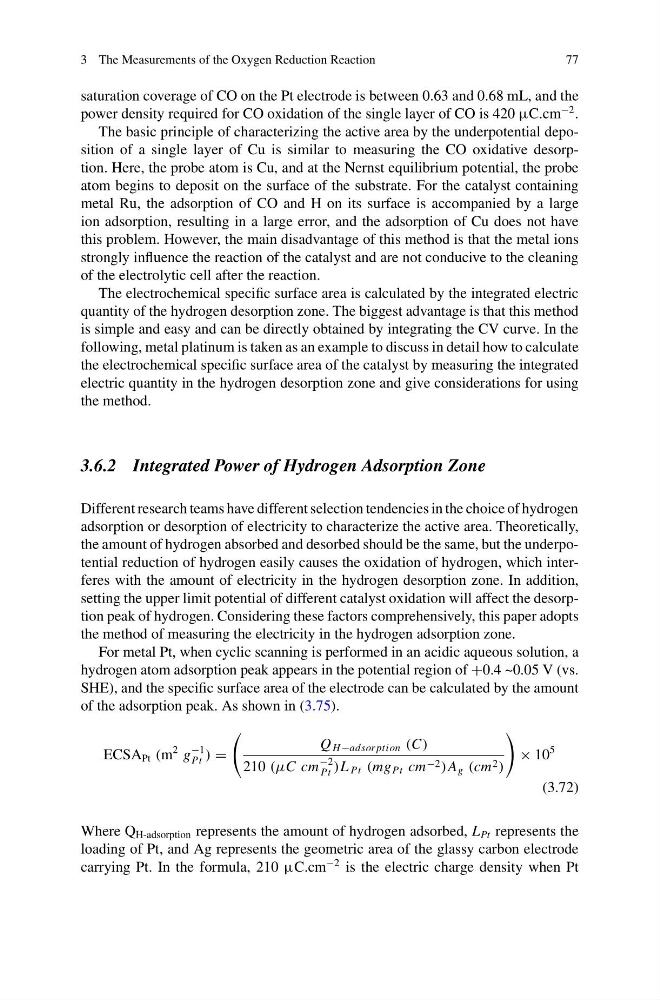
For metal Pt, when cyclic scanning is performed in an acidic aqueous solution, a
hydrogen atom adsorption peak appears in the potential region of +0.4 ~0.05 V (vs.
SHE), and the specific surface area of the electrode can be calculated by the amount
of the adsorption peak. As shown in (3.75).
ECSA Pt (m
2 g
−1
Pt ) =
Q H −adsor ption (C)
210 (μC cm
−2
Pt )L Pt (mg Pt cm −2 )A g (cm 2 )
× 10
5
(3.72)
Where Q H-adsorption represents the amount of hydrogen adsorbed, L Pt represents the
loading of Pt, and Ag represents the geometric area of the glassy carbon electrode
carrying Pt. In the formula, 210 μC.cm
−2 is the electric charge density when Pt
77
saturation coverage of CO on the Pt electrode is between 0.63 and 0.68 mL, and the
power density required for CO oxidation of the single layer of CO is 420 μC.cm
−2 .
The basic principle of characterizing the active area by the underpotential deposition of a single layer of Cu is similar to measuring the CO oxidative desorption. Here, the probe atom is Cu, and at the Nernst equilibrium potential, the probe
atom begins to deposit on the surface of the substrate. For the catalyst containing
metal Ru, the adsorption of CO and H on its surface is accompanied by a large
ion adsorption, resulting in a large error, and the adsorption of Cu does not have
this problem. However, the main disadvantage of this method is that the metal ions
strongly influence the reaction of the catalyst and are not conducive to the cleaning
of the electrolytic cell after the reaction.
The electrochemical specific surface area is calculated by the integrated electric
quantity of the hydrogen desorption zone. The biggest advantage is that this method
is simple and easy and can be directly obtained by integrating the CV curve. In the
following, metal platinum is taken as an example to discuss in detail how to calculate
the electrochemical specific surface area of the catalyst by measuring the integrated
electric quantity in the hydrogen desorption zone and give considerations for using
the method.
3.6.2 Integrated Power of Hydrogen Adsorption Zone
Different research teams have different selection tendencies in the choice of hydrogen
adsorption or desorption of electricity to characterize the active area. Theoretically,
the amount of hydrogen absorbed and desorbed should be the same, but the underpotential reduction of hydrogen easily causes the oxidation of hydrogen, which interferes with the amount of electricity in the hydrogen desorption zone. In addition,
setting the upper limit potential of different catalyst oxidation will affect the desorption peak of hydrogen. Considering these factors comprehensively, this paper adopts
the method of measuring the electricity in the hydrogen adsorption zone.
For metal Pt, when cyclic scanning is performed in an acidic aqueous solution, a
hydrogen atom adsorption peak appears in the potential region of +0.4 ~0.05 V (vs.
SHE), and the specific surface area of the electrode can be calculated by the amount
of the adsorption peak. As shown in (3.75).
ECSA Pt (m
2 g
−1
Pt ) =
Q H −adsor ption (C)
210 (μC cm
−2
Pt )L Pt (mg Pt cm −2 )A g (cm 2 )
× 10
5
(3.72)
Where Q H-adsorption represents the amount of hydrogen adsorbed, L Pt represents the
loading of Pt, and Ag represents the geometric area of the glassy carbon electrode
carrying Pt. In the formula, 210 μC.cm
−2 is the electric charge density when Pt