

3 The Measurements of the Oxygen Reduction Reaction
55
0.0
0.2
0.4
0.6
0.8
1.0
1.2
-7
-6
-5
-4
-3
-2
-1
0
i
disk
/mAcm -2
E/ V vs.RHE
(a)
0
2
4
6
8
10
0.1mol L
-1 HClO 4
0.1mol L
-1 HClO 4 +10
-2
mol L
-1 NaClO 4
0.1mol L
-1 HClO 4 +10
-1
mol L
-1 NaClO 4
0.1mol L
-1 HClO 4 +1 mol L
-1 NaClO 4
i
ring
/uA
0.70
0.75
0.80
0.85
0.90
3.97
3.98
3.99
4.00
n
E/Vvs.RHE
0.1mol L
-1 HClO 4
0.1mol L
-1 HClO 4 +10
-2 mol L
-1 NaClO 4
0.1mol L
-1 HClO 4 +10
-1 mol L
-1 NaClO 4
0.1mol L
-1 HClO 4 +1mol L
-1 NaClO 4
(b)
0.2
0.4
0.6
0.8
0.0
0.5
1.0
1.5
2.0
2.5
3.0
3.5
4.0
H
2 O
2 %
E/Vvs.RHE
0.1mol L
-1 HClO 4
0.1mol L
-1 HClO 4 +10
-2
mol L
-1 NaClO 4
0.1mol L
-1 HClO 4 +10
-1
mol L
-1 NaClO 4
0.1mol L
-1 HClO 4 +1mol L
-1 NaClO 4
(C)
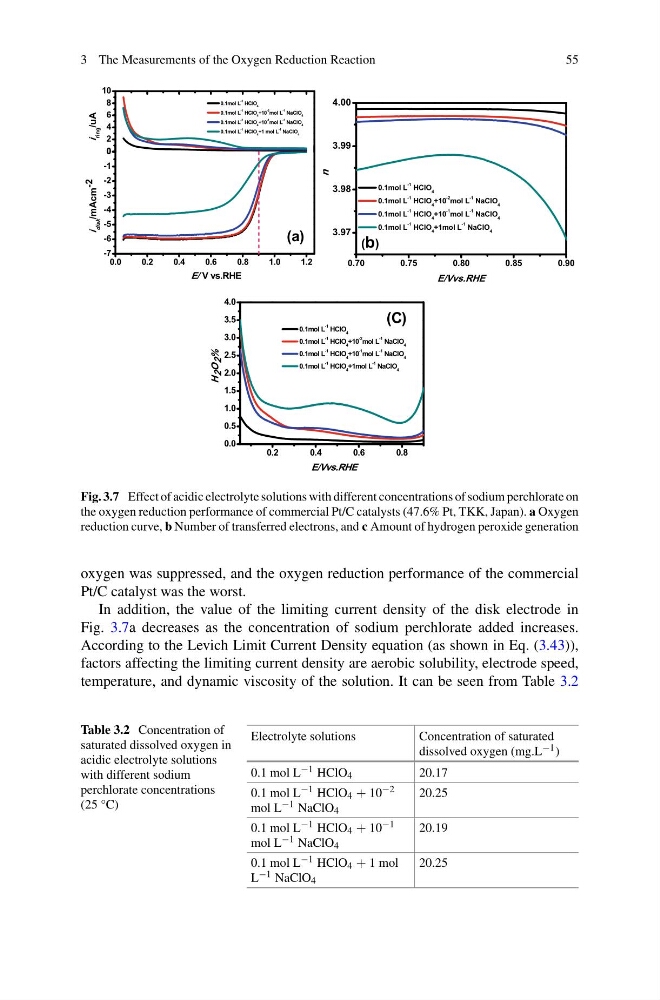
Fig. 3.7 Effect of acidic electrolyte solutions with different concentrations of sodium perchlorate on
the oxygen reduction performance of commercial Pt/C catalysts (47.6% Pt, TKK, Japan). a Oxygen
reduction curve, b Number of transferred electrons, and c Amount of hydrogen peroxide generation
oxygen was suppressed, and the oxygen reduction performance of the commercial
Pt/C catalyst was the worst.
In addition, the value of the limiting current density of the disk electrode in
Fig. 3.7a decreases as the concentration of sodium perchlorate added increases.
According to the Levich Limit Current Density equation (as shown in Eq. (3.43)),
factors affecting the limiting current density are aerobic solubility, electrode speed,
temperature, and dynamic viscosity of the solution. It can be seen from Table 3.2
Table 3.2 Concentration of
saturated dissolved oxygen in
acidic electrolyte solutions
with different sodium
perchlorate concentrations
(25 °C)
Electrolyte solutions
Concentration of saturated
dissolved oxygen (mg.L −1 )
0.1 mol L −1 HClO 4
20.17
0.1 mol L −1 HClO 4 + 10 −2
mol L −1 NaClO 4
20.25
0.1 mol L −1 HClO 4 + 10 −1
mol L −1 NaClO 4
20.19
0.1 mol L −1 HClO 4 + 1 mol
L −1 NaClO 4
20.25
55
0.0
0.2
0.4
0.6
0.8
1.0
1.2
-7
-6
-5
-4
-3
-2
-1
0
i
disk
/mAcm -2
E/ V vs.RHE
(a)
0
2
4
6
8
10
0.1mol L
-1 HClO 4
0.1mol L
-1 HClO 4 +10
-2
mol L
-1 NaClO 4
0.1mol L
-1 HClO 4 +10
-1
mol L
-1 NaClO 4
0.1mol L
-1 HClO 4 +1 mol L
-1 NaClO 4
i
ring
/uA
0.70
0.75
0.80
0.85
0.90
3.97
3.98
3.99
4.00
n
E/Vvs.RHE
0.1mol L
-1 HClO 4
0.1mol L
-1 HClO 4 +10
-2 mol L
-1 NaClO 4
0.1mol L
-1 HClO 4 +10
-1 mol L
-1 NaClO 4
0.1mol L
-1 HClO 4 +1mol L
-1 NaClO 4
(b)
0.2
0.4
0.6
0.8
0.0
0.5
1.0
1.5
2.0
2.5
3.0
3.5
4.0
H
2 O
2 %
E/Vvs.RHE
0.1mol L
-1 HClO 4
0.1mol L
-1 HClO 4 +10
-2
mol L
-1 NaClO 4
0.1mol L
-1 HClO 4 +10
-1
mol L
-1 NaClO 4
0.1mol L
-1 HClO 4 +1mol L
-1 NaClO 4
(C)
Fig. 3.7 Effect of acidic electrolyte solutions with different concentrations of sodium perchlorate on
the oxygen reduction performance of commercial Pt/C catalysts (47.6% Pt, TKK, Japan). a Oxygen
reduction curve, b Number of transferred electrons, and c Amount of hydrogen peroxide generation
oxygen was suppressed, and the oxygen reduction performance of the commercial
Pt/C catalyst was the worst.
In addition, the value of the limiting current density of the disk electrode in
Fig. 3.7a decreases as the concentration of sodium perchlorate added increases.
According to the Levich Limit Current Density equation (as shown in Eq. (3.43)),
factors affecting the limiting current density are aerobic solubility, electrode speed,
temperature, and dynamic viscosity of the solution. It can be seen from Table 3.2
Table 3.2 Concentration of
saturated dissolved oxygen in
acidic electrolyte solutions
with different sodium
perchlorate concentrations
(25 °C)
Electrolyte solutions
Concentration of saturated
dissolved oxygen (mg.L −1 )
0.1 mol L −1 HClO 4
20.17
0.1 mol L −1 HClO 4 + 10 −2
mol L −1 NaClO 4
20.25
0.1 mol L −1 HClO 4 + 10 −1
mol L −1 NaClO 4
20.19
0.1 mol L −1 HClO 4 + 1 mol
L −1 NaClO 4
20.25