

56
C. Juhong et al.
that the addition of different concentrations of NaClO 4 to 0.1 mol·L
−1 HClO 4 has
little effect on the concentration of saturated dissolved oxygen at 25 °C. Therefore,
in the case of a certain speed and temperature, the possible cause of the decrease in
the limit current density is that the dynamic viscosity of the solution increases as the
salt concentration increases, resulting in a decrease in the limit current density value.
i d = 0.62nFD
2/3
0 ω
1/2 v
−1/6 C 0
(3.43)
where ω is the angular velocity, v is the dynamic viscosity (cm
2 .s
−1 ), C 0 is the
concentration (mol·L
−1 ), and D 0 is the diffusion coefficient (cm.s
−1 ).
3.3.3.3 Analysis of Oxygen Reduction Activity
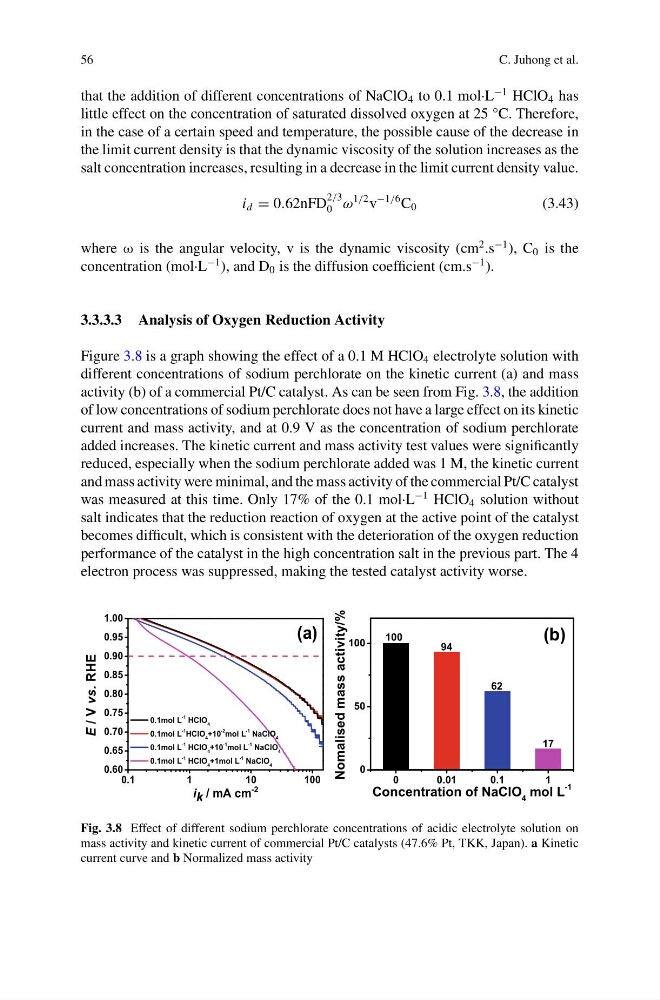
Figure 3.8 is a graph showing the effect of a 0.1 M HClO 4 electrolyte solution with
different concentrations of sodium perchlorate on the kinetic current (a) and mass
activity (b) of a commercial Pt/C catalyst. As can be seen from Fig. 3.8, the addition
of low concentrations of sodium perchlorate does not have a large effect on its kinetic
current and mass activity, and at 0.9 V as the concentration of sodium perchlorate
added increases. The kinetic current and mass activity test values were significantly
reduced, especially when the sodium perchlorate added was 1 M, the kinetic current
and mass activity were minimal, and the mass activity of the commercial Pt/C catalyst
was measured at this time. Only 17% of the 0.1 mol·L
−1 HClO 4 solution without
salt indicates that the reduction reaction of oxygen at the active point of the catalyst
becomes difficult, which is consistent with the deterioration of the oxygen reduction
performance of the catalyst in the high concentration salt in the previous part. The 4
electron process was suppressed, making the tested catalyst activity worse.
0.1
1
10
100
0.60
0.65
0.70
0.75
0.80
0.85
0.90
0.95
1.00
E / V
vs. RHE
i k / mA cm
-2
0.1mol L
-1 HClO 4
0.1mol L
-1 HClO 4 +10
-2
mol L
-1 NaClO 4
0.1mol L -1 HClO 4 +10 -1 mol L -1 NaClO 4
0.1mol L -1 HClO 4 +1mol L -1 NaClO 4
(a)
0
0 . 0 1
0 . 1
1
0
50
100
17
100
62
94
Nomalised mass activity/%
Concentration of NaClO 4 mol L
-1
(b)
Fig. 3.8 Effect of different sodium perchlorate concentrations of acidic electrolyte solution on
mass activity and kinetic current of commercial Pt/C catalysts (47.6% Pt, TKK, Japan). a Kinetic
current curve and b Normalized mass activity
C. Juhong et al.
that the addition of different concentrations of NaClO 4 to 0.1 mol·L
−1 HClO 4 has
little effect on the concentration of saturated dissolved oxygen at 25 °C. Therefore,
in the case of a certain speed and temperature, the possible cause of the decrease in
the limit current density is that the dynamic viscosity of the solution increases as the
salt concentration increases, resulting in a decrease in the limit current density value.
i d = 0.62nFD
2/3
0 ω
1/2 v
−1/6 C 0
(3.43)
where ω is the angular velocity, v is the dynamic viscosity (cm
2 .s
−1 ), C 0 is the
concentration (mol·L
−1 ), and D 0 is the diffusion coefficient (cm.s
−1 ).
3.3.3.3 Analysis of Oxygen Reduction Activity
Figure 3.8 is a graph showing the effect of a 0.1 M HClO 4 electrolyte solution with
different concentrations of sodium perchlorate on the kinetic current (a) and mass
activity (b) of a commercial Pt/C catalyst. As can be seen from Fig. 3.8, the addition
of low concentrations of sodium perchlorate does not have a large effect on its kinetic
current and mass activity, and at 0.9 V as the concentration of sodium perchlorate
added increases. The kinetic current and mass activity test values were significantly
reduced, especially when the sodium perchlorate added was 1 M, the kinetic current
and mass activity were minimal, and the mass activity of the commercial Pt/C catalyst
was measured at this time. Only 17% of the 0.1 mol·L
−1 HClO 4 solution without
salt indicates that the reduction reaction of oxygen at the active point of the catalyst
becomes difficult, which is consistent with the deterioration of the oxygen reduction
performance of the catalyst in the high concentration salt in the previous part. The 4
electron process was suppressed, making the tested catalyst activity worse.
0.1
1
10
100
0.60
0.65
0.70
0.75
0.80
0.85
0.90
0.95
1.00
E / V
vs. RHE
i k / mA cm
-2
0.1mol L
-1 HClO 4
0.1mol L
-1 HClO 4 +10
-2
mol L
-1 NaClO 4
0.1mol L -1 HClO 4 +10 -1 mol L -1 NaClO 4
0.1mol L -1 HClO 4 +1mol L -1 NaClO 4
(a)
0
0 . 0 1
0 . 1
1
0
50
100
17
100
62
94
Nomalised mass activity/%
Concentration of NaClO 4 mol L
-1
(b)
Fig. 3.8 Effect of different sodium perchlorate concentrations of acidic electrolyte solution on
mass activity and kinetic current of commercial Pt/C catalysts (47.6% Pt, TKK, Japan). a Kinetic
current curve and b Normalized mass activity