

498
Y. Yoshida
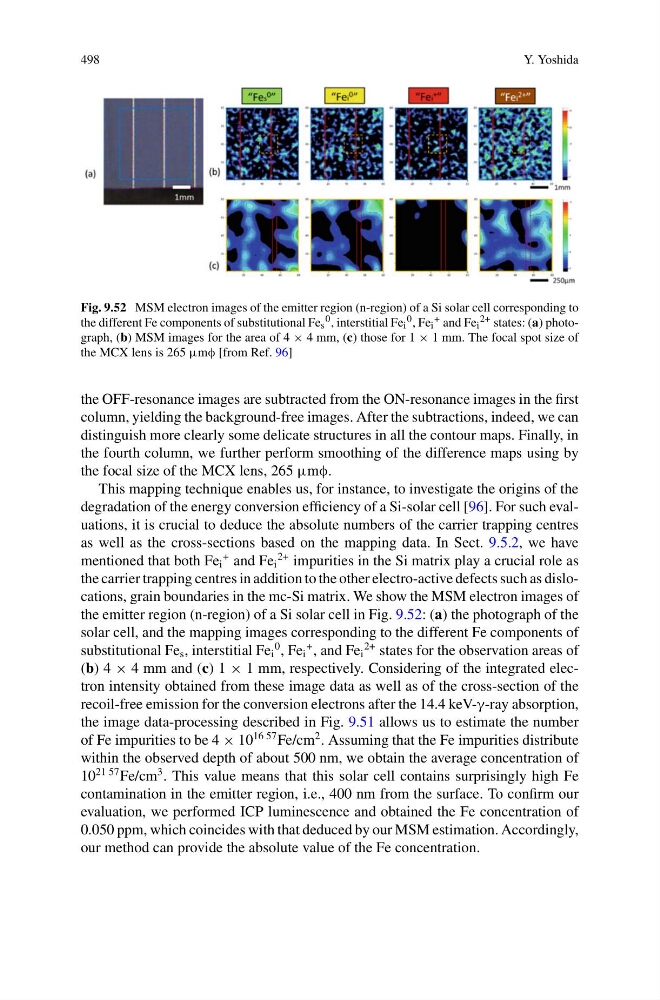
Fig. 9.52 MSM electron images of the emitter region (n-region) of a Si solar cell corresponding to
the different Fe components of substitutional Fe s
0 , interstitial Fe i
0 , Fe i
+ and Fe i
2+ states: (a) photograph, (b) MSM images for the area of 4 × 4 mm, (c) those for 1 × 1 mm. The focal spot size of
the MCX lens is 265 μmφ [from Ref. 96]
the OFF-resonance images are subtracted from the ON-resonance images in the first
column, yielding the background-free images. After the subtractions, indeed, we can
distinguish more clearly some delicate structures in all the contour maps. Finally, in
the fourth column, we further perform smoothing of the difference maps using by
the focal size of the MCX lens, 265 μmφ.
This mapping technique enables us, for instance, to investigate the origins of the
degradation of the energy conversion efficiency of a Si-solar cell [96]. For such evaluations, it is crucial to deduce the absolute numbers of the carrier trapping centres
as well as the cross-sections based on the mapping data. In Sect. 9.5.2, we have
mentioned that both Fe i
+ and Fe i
2+ impurities in the Si matrix play a crucial role as
the carrier trapping centres in addition to the other electro-active defects such as dislocations, grain boundaries in the mc-Si matrix. We show the MSM electron images of
the emitter region (n-region) of a Si solar cell in Fig. 9.52: (a) the photograph of the
solar cell, and the mapping images corresponding to the different Fe components of
substitutional Fe s , interstitial Fe i
0 , Fe i
+ , and Fe i
2+ states for the observation areas of
(b) 4 × 4 mm and (c) 1 × 1 mm, respectively. Considering of the integrated electron intensity obtained from these image data as well as of the cross-section of the
recoil-free emission for the conversion electrons after the 14.4 keV-γ-ray absorption,
the image data-processing described in Fig. 9.51 allows us to estimate the number
of Fe impurities to be 4 × 10
16 57 Fe/cm
2 . Assuming that the Fe impurities distribute
within the observed depth of about 500 nm, we obtain the average concentration of
10
21 57 Fe/cm
3 . This value means that this solar cell contains surprisingly high Fe
contamination in the emitter region, i.e., 400 nm from the surface. To confirm our
evaluation, we performed ICP luminescence and obtained the Fe concentration of
0.050 ppm, which coincides with that deduced by our MSM estimation. Accordingly,
our method can provide the absolute value of the Fe concentration.
Y. Yoshida
Fig. 9.52 MSM electron images of the emitter region (n-region) of a Si solar cell corresponding to
the different Fe components of substitutional Fe s
0 , interstitial Fe i
0 , Fe i
+ and Fe i
2+ states: (a) photograph, (b) MSM images for the area of 4 × 4 mm, (c) those for 1 × 1 mm. The focal spot size of
the MCX lens is 265 μmφ [from Ref. 96]
the OFF-resonance images are subtracted from the ON-resonance images in the first
column, yielding the background-free images. After the subtractions, indeed, we can
distinguish more clearly some delicate structures in all the contour maps. Finally, in
the fourth column, we further perform smoothing of the difference maps using by
the focal size of the MCX lens, 265 μmφ.
This mapping technique enables us, for instance, to investigate the origins of the
degradation of the energy conversion efficiency of a Si-solar cell [96]. For such evaluations, it is crucial to deduce the absolute numbers of the carrier trapping centres
as well as the cross-sections based on the mapping data. In Sect. 9.5.2, we have
mentioned that both Fe i
+ and Fe i
2+ impurities in the Si matrix play a crucial role as
the carrier trapping centres in addition to the other electro-active defects such as dislocations, grain boundaries in the mc-Si matrix. We show the MSM electron images of
the emitter region (n-region) of a Si solar cell in Fig. 9.52: (a) the photograph of the
solar cell, and the mapping images corresponding to the different Fe components of
substitutional Fe s , interstitial Fe i
0 , Fe i
+ , and Fe i
2+ states for the observation areas of
(b) 4 × 4 mm and (c) 1 × 1 mm, respectively. Considering of the integrated electron intensity obtained from these image data as well as of the cross-section of the
recoil-free emission for the conversion electrons after the 14.4 keV-γ-ray absorption,
the image data-processing described in Fig. 9.51 allows us to estimate the number
of Fe impurities to be 4 × 10
16 57 Fe/cm
2 . Assuming that the Fe impurities distribute
within the observed depth of about 500 nm, we obtain the average concentration of
10
21 57 Fe/cm
3 . This value means that this solar cell contains surprisingly high Fe
contamination in the emitter region, i.e., 400 nm from the surface. To confirm our
evaluation, we performed ICP luminescence and obtained the Fe concentration of
0.050 ppm, which coincides with that deduced by our MSM estimation. Accordingly,
our method can provide the absolute value of the Fe concentration.