

9 Mössbauer Spectroscopic Studies on Atomic Diffusion in Materials
497
9.5.3 MSM Image Data Processing to Deduce
the Concentration Distributions
It is fundamentally important to realize a background-free measuring system to
determine the concentration distributions for the Fe components. In our practice,
we measure the electrons and the transmitted γ-rays simultaneously under the ONresonance and the OFF-resonance conditions. Then, we subtract the latter from the
former counts at each mapping point. Accordingly, we can produce the electron and γray intensity distributions originating only from the Mössbauer effect. Furthermore,
we create the image data consisting of typically an 80 × 80 matrix finally converted to
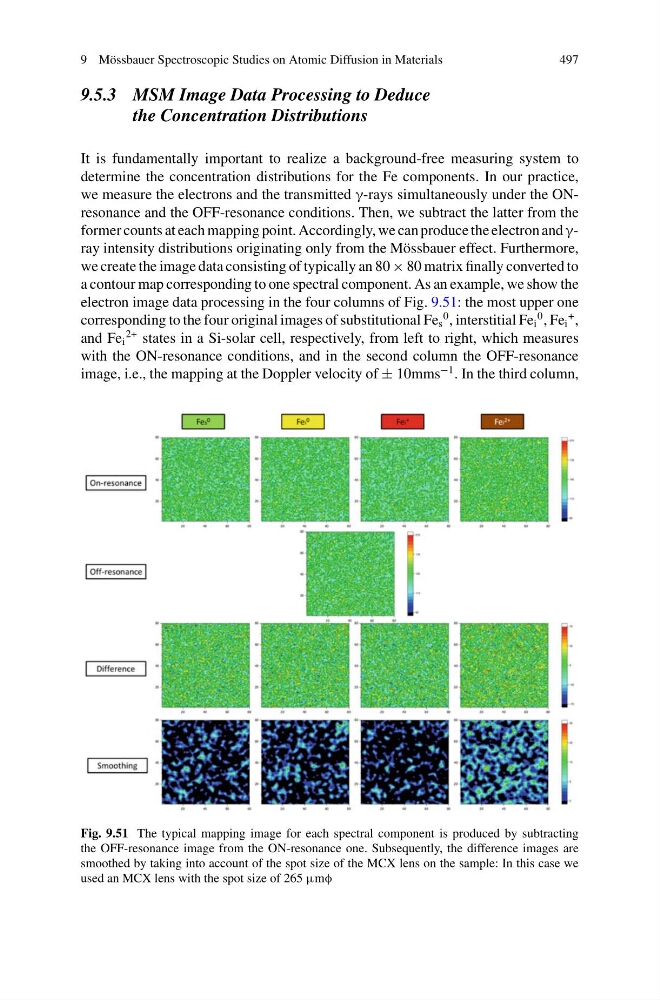
a contour map corresponding to one spectral component. As an example, we show the
electron image data processing in the four columns of Fig. 9.51: the most upper one
corresponding to the four original images of substitutional Fe s
0 , interstitial Fe i
0 , Fe i
+ ,
and Fe i
2+ states in a Si-solar cell, respectively, from left to right, which measures
with the ON-resonance conditions, and in the second column the OFF-resonance
image, i.e., the mapping at the Doppler velocity of ± 10mms
−1 . In the third column,
Fig. 9.51 The typical mapping image for each spectral component is produced by subtracting
the OFF-resonance image from the ON-resonance one. Subsequently, the difference images are
smoothed by taking into account of the spot size of the MCX lens on the sample: In this case we
used an MCX lens with the spot size of 265 μmφ
497
9.5.3 MSM Image Data Processing to Deduce
the Concentration Distributions
It is fundamentally important to realize a background-free measuring system to
determine the concentration distributions for the Fe components. In our practice,
we measure the electrons and the transmitted γ-rays simultaneously under the ONresonance and the OFF-resonance conditions. Then, we subtract the latter from the
former counts at each mapping point. Accordingly, we can produce the electron and γray intensity distributions originating only from the Mössbauer effect. Furthermore,
we create the image data consisting of typically an 80 × 80 matrix finally converted to
a contour map corresponding to one spectral component. As an example, we show the
electron image data processing in the four columns of Fig. 9.51: the most upper one
corresponding to the four original images of substitutional Fe s
0 , interstitial Fe i
0 , Fe i
+ ,
and Fe i
2+ states in a Si-solar cell, respectively, from left to right, which measures
with the ON-resonance conditions, and in the second column the OFF-resonance
image, i.e., the mapping at the Doppler velocity of ± 10mms
−1 . In the third column,
Fig. 9.51 The typical mapping image for each spectral component is produced by subtracting
the OFF-resonance image from the ON-resonance one. Subsequently, the difference images are
smoothed by taking into account of the spot size of the MCX lens on the sample: In this case we
used an MCX lens with the spot size of 265 μmφ