

9 Mössbauer Spectroscopic Studies on Atomic Diffusion in Materials
495
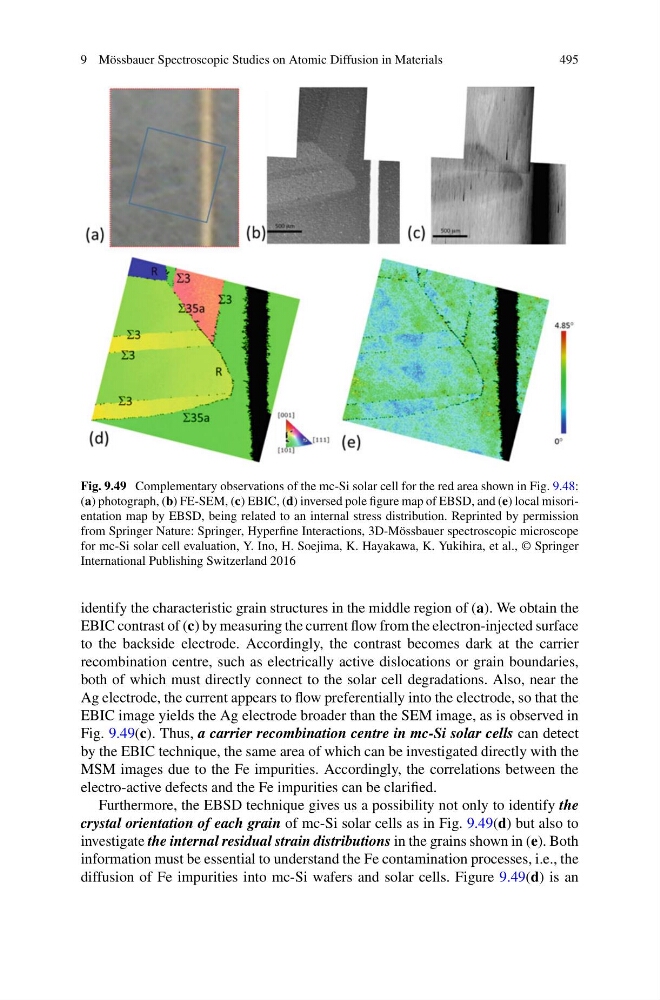
Fig. 9.49 Complementary observations of the mc-Si solar cell for the red area shown in Fig. 9.48:
(a) photograph, (b) FE-SEM, (c) EBIC, (d) inversed pole figure map of EBSD, and (e) local misorientation map by EBSD, being related to an internal stress distribution. Reprinted by permission
from Springer Nature: Springer, Hyperfine Interactions, 3D-Mössbauer spectroscopic microscope
for mc-Si solar cell evaluation, Y. Ino, H. Soejima, K. Hayakawa, K. Yukihira, et al., © Springer
International Publishing Switzerland 2016
identify the characteristic grain structures in the middle region of (a). We obtain the
EBIC contrast of (c) by measuring the current flow from the electron-injected surface
to the backside electrode. Accordingly, the contrast becomes dark at the carrier
recombination centre, such as electrically active dislocations or grain boundaries,
both of which must directly connect to the solar cell degradations. Also, near the
Ag electrode, the current appears to flow preferentially into the electrode, so that the
EBIC image yields the Ag electrode broader than the SEM image, as is observed in
Fig. 9.49(c). Thus, a carrier recombination centre in mc-Si solar cells can detect
by the EBIC technique, the same area of which can be investigated directly with the
MSM images due to the Fe impurities. Accordingly, the correlations between the
electro-active defects and the Fe impurities can be clarified.
Furthermore, the EBSD technique gives us a possibility not only to identify the
crystal orientation of each grain of mc-Si solar cells as in Fig. 9.49(d) but also to
investigate the internal residual strain distributions in the grains shown in (e). Both
information must be essential to understand the Fe contamination processes, i.e., the
diffusion of Fe impurities into mc-Si wafers and solar cells. Figure 9.49(d) is an
495
Fig. 9.49 Complementary observations of the mc-Si solar cell for the red area shown in Fig. 9.48:
(a) photograph, (b) FE-SEM, (c) EBIC, (d) inversed pole figure map of EBSD, and (e) local misorientation map by EBSD, being related to an internal stress distribution. Reprinted by permission
from Springer Nature: Springer, Hyperfine Interactions, 3D-Mössbauer spectroscopic microscope
for mc-Si solar cell evaluation, Y. Ino, H. Soejima, K. Hayakawa, K. Yukihira, et al., © Springer
International Publishing Switzerland 2016
identify the characteristic grain structures in the middle region of (a). We obtain the
EBIC contrast of (c) by measuring the current flow from the electron-injected surface
to the backside electrode. Accordingly, the contrast becomes dark at the carrier
recombination centre, such as electrically active dislocations or grain boundaries,
both of which must directly connect to the solar cell degradations. Also, near the
Ag electrode, the current appears to flow preferentially into the electrode, so that the
EBIC image yields the Ag electrode broader than the SEM image, as is observed in
Fig. 9.49(c). Thus, a carrier recombination centre in mc-Si solar cells can detect
by the EBIC technique, the same area of which can be investigated directly with the
MSM images due to the Fe impurities. Accordingly, the correlations between the
electro-active defects and the Fe impurities can be clarified.
Furthermore, the EBSD technique gives us a possibility not only to identify the
crystal orientation of each grain of mc-Si solar cells as in Fig. 9.49(d) but also to
investigate the internal residual strain distributions in the grains shown in (e). Both
information must be essential to understand the Fe contamination processes, i.e., the
diffusion of Fe impurities into mc-Si wafers and solar cells. Figure 9.49(d) is an