

6 Molecular Magnetism of Metal Complexes and Light-Induced …
311
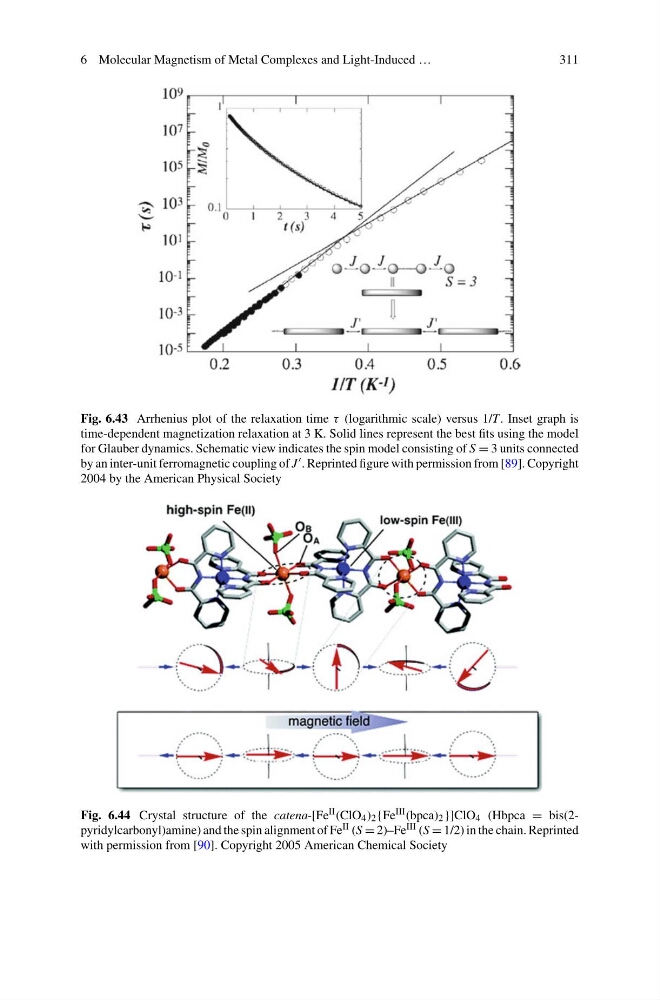
Fig. 6.43 Arrhenius plot of the relaxation time τ (logarithmic scale) versus 1/T. Inset graph is
time-dependent magnetization relaxation at 3 K. Solid lines represent the best fits using the model
for Glauber dynamics. Schematic view indicates the spin model consisting of S = 3 units connected
by an inter-unit ferromagnetic coupling of J . Reprinted figure with permission from [89]. Copyright
2004 by the American Physical Society
Fig. 6.44 Crystal structure of the catena-[Fe II (ClO 4 ) 2 {Fe III (bpca) 2 }]ClO 4 (Hbpca = bis(2pyridylcarbonyl)amine) and the spin alignment of Fe II (S = 2)–Fe III (S = 1/2) in the chain. Reprinted
with permission from [90]. Copyright 2005 American Chemical Society
311
Fig. 6.43 Arrhenius plot of the relaxation time τ (logarithmic scale) versus 1/T. Inset graph is
time-dependent magnetization relaxation at 3 K. Solid lines represent the best fits using the model
for Glauber dynamics. Schematic view indicates the spin model consisting of S = 3 units connected
by an inter-unit ferromagnetic coupling of J . Reprinted figure with permission from [89]. Copyright
2004 by the American Physical Society
Fig. 6.44 Crystal structure of the catena-[Fe II (ClO 4 ) 2 {Fe III (bpca) 2 }]ClO 4 (Hbpca = bis(2pyridylcarbonyl)amine) and the spin alignment of Fe II (S = 2)–Fe III (S = 1/2) in the chain. Reprinted
with permission from [90]. Copyright 2005 American Chemical Society