

286
N. Kojima and A. Okazawa
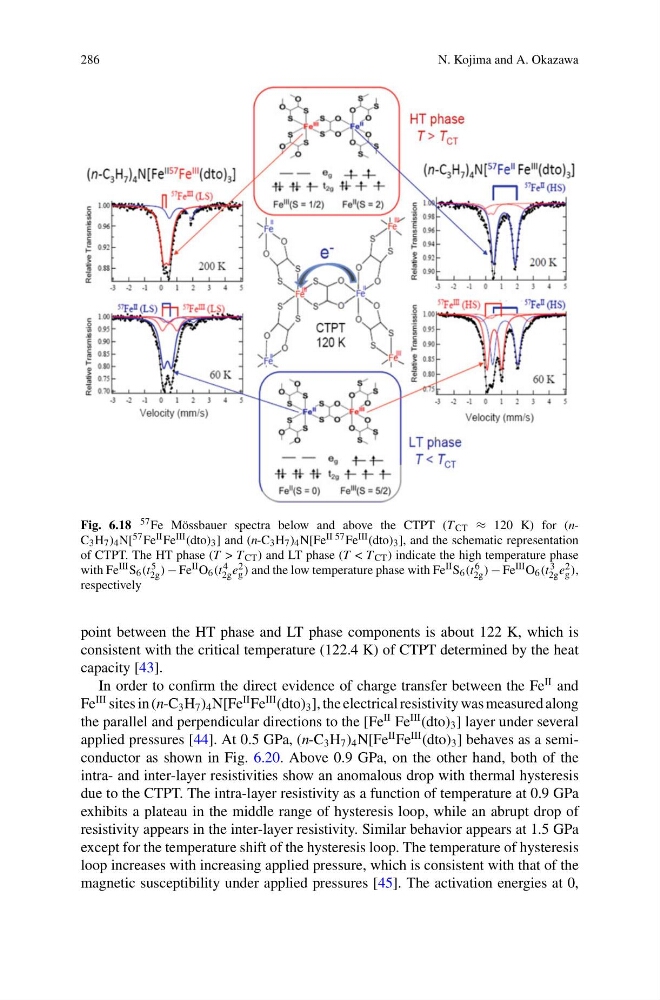
Fig. 6.18 57 Fe Mössbauer spectra below and above the CTPT (T CT ≈ 120 K) for (nC 3 H 7 ) 4 N[ 57 Fe II Fe III (dto) 3 ] and (n-C 3 H 7 ) 4 N[Fe II 57 Fe III (dto) 3 ], and the schematic representation
of CTPT. The HT phase (T > T CT ) and LT phase (T < T CT ) indicate the high temperature phase
with Fe III S 6 (t 5
2g ) − Fe II O 6 (t 4
2g e 2
g ) and the low temperature phase with Fe II S 6 (t 6
2g ) − Fe III O 6 (t 3
2g e 2
g ),
respectively
point between the HT phase and LT phase components is about 122 K, which is
consistent with the critical temperature (122.4 K) of CTPT determined by the heat
capacity [43].
In order to confirm the direct evidence of charge transfer between the Fe
II and
Fe
III sites in (n-C 3 H 7 ) 4 N[Fe
II Fe
III (dto) 3 ], the electrical resistivity was measured along
the parallel and perpendicular directions to the [Fe
II Fe
III (dto) 3 ] layer under several
applied pressures [44]. At 0.5 GPa, (n-C 3 H 7 ) 4 N[Fe
II Fe
III (dto) 3 ] behaves as a semiconductor as shown in Fig. 6.20. Above 0.9 GPa, on the other hand, both of the
intra- and inter-layer resistivities show an anomalous drop with thermal hysteresis
due to the CTPT. The intra-layer resistivity as a function of temperature at 0.9 GPa
exhibits a plateau in the middle range of hysteresis loop, while an abrupt drop of
resistivity appears in the inter-layer resistivity. Similar behavior appears at 1.5 GPa
except for the temperature shift of the hysteresis loop. The temperature of hysteresis
loop increases with increasing applied pressure, which is consistent with that of the
magnetic susceptibility under applied pressures [45]. The activation energies at 0,
N. Kojima and A. Okazawa
Fig. 6.18 57 Fe Mössbauer spectra below and above the CTPT (T CT ≈ 120 K) for (nC 3 H 7 ) 4 N[ 57 Fe II Fe III (dto) 3 ] and (n-C 3 H 7 ) 4 N[Fe II 57 Fe III (dto) 3 ], and the schematic representation
of CTPT. The HT phase (T > T CT ) and LT phase (T < T CT ) indicate the high temperature phase
with Fe III S 6 (t 5
2g ) − Fe II O 6 (t 4
2g e 2
g ) and the low temperature phase with Fe II S 6 (t 6
2g ) − Fe III O 6 (t 3
2g e 2
g ),
respectively
point between the HT phase and LT phase components is about 122 K, which is
consistent with the critical temperature (122.4 K) of CTPT determined by the heat
capacity [43].
In order to confirm the direct evidence of charge transfer between the Fe
II and
Fe
III sites in (n-C 3 H 7 ) 4 N[Fe
II Fe
III (dto) 3 ], the electrical resistivity was measured along
the parallel and perpendicular directions to the [Fe
II Fe
III (dto) 3 ] layer under several
applied pressures [44]. At 0.5 GPa, (n-C 3 H 7 ) 4 N[Fe
II Fe
III (dto) 3 ] behaves as a semiconductor as shown in Fig. 6.20. Above 0.9 GPa, on the other hand, both of the
intra- and inter-layer resistivities show an anomalous drop with thermal hysteresis
due to the CTPT. The intra-layer resistivity as a function of temperature at 0.9 GPa
exhibits a plateau in the middle range of hysteresis loop, while an abrupt drop of
resistivity appears in the inter-layer resistivity. Similar behavior appears at 1.5 GPa
except for the temperature shift of the hysteresis loop. The temperature of hysteresis
loop increases with increasing applied pressure, which is consistent with that of the
magnetic susceptibility under applied pressures [45]. The activation energies at 0,