

6 Molecular Magnetism of Metal Complexes and Light-Induced …
285
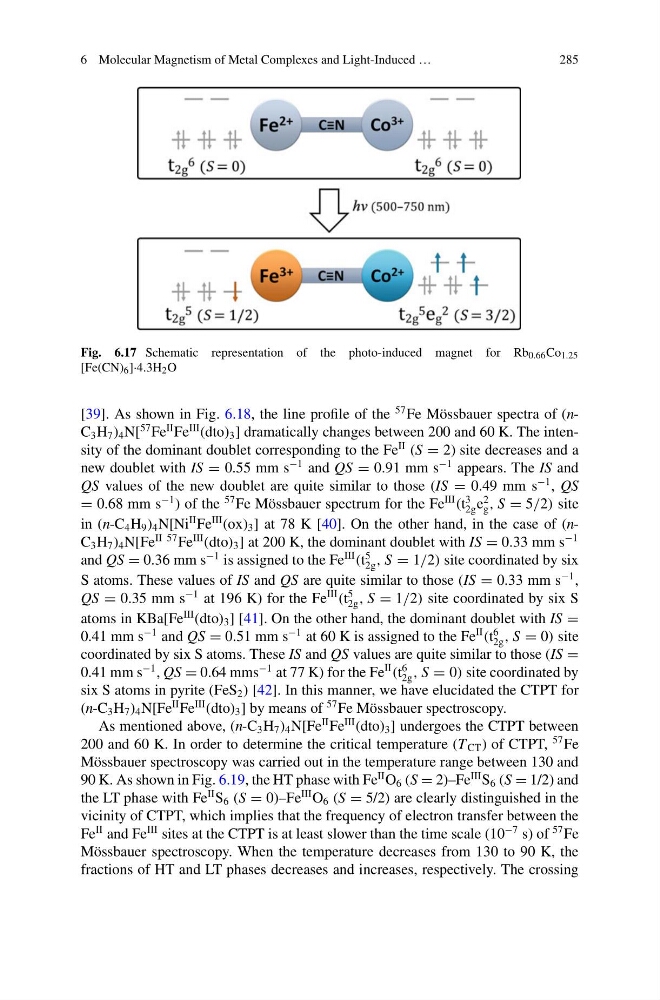
Fig. 6.17 Schematic representation of the photo-induced magnet for Rb 0.66 Co 1.25
[Fe(CN) 6 ]·4.3H 2 O
[39]. As shown in Fig. 6.18, the line profile of the
57 Fe Mössbauer spectra of (nC 3 H 7 ) 4 N[
57 Fe
II Fe
III (dto) 3 ] dramatically changes between 200 and 60 K. The intensity of the dominant doublet corresponding to the Fe
II (S = 2) site decreases and a
new doublet with IS = 0.55 mm s
−1 and QS = 0.91 mm s
−1 appears. The IS and
QS values of the new doublet are quite similar to those (IS = 0.49 mm s
−1 , QS
= 0.68 mm s
−1 ) of the
57 Fe Mössbauer spectrum for the Fe
III
(t
3
2g e
2
g , S = 5/2) site
in (n-C 4 H 9 ) 4 N[Ni
II Fe
III (ox) 3 ] at 78 K [40]. On the other hand, in the case of (nC 3 H 7 ) 4 N[Fe
II 57 Fe
III (dto) 3 ] at 200 K, the dominant doublet with IS = 0.33 mm s
−1
and QS = 0.36 mm s
−1 is assigned to the Fe
III
(t
5
2g , S = 1/2) site coordinated by six
S atoms. These values of IS and QS are quite similar to those (IS = 0.33 mm s
−1 ,
QS = 0.35 mm s
−1 at 196 K) for the Fe
III
(t
5
2g , S = 1/2) site coordinated by six S
atoms in KBa[Fe
III (dto) 3 ] [41]. On the other hand, the dominant doublet with IS =
0.41 mm s
−1 and QS = 0.51 mm s
−1 at 60 K is assigned to the Fe
II
(t
6
2g , S = 0) site
coordinated by six S atoms. These IS and QS values are quite similar to those (IS =
0.41 mm s
−1 , QS = 0.64 mms
−1 at 77 K) for the Fe
II
(t
6
2g , S = 0) site coordinated by
six S atoms in pyrite (FeS 2 ) [42]. In this manner, we have elucidated the CTPT for
(n-C 3 H 7 ) 4 N[Fe
II Fe
III (dto) 3 ] by means of
57 Fe Mössbauer spectroscopy.
As mentioned above, (n-C 3 H 7 ) 4 N[Fe
II Fe
III (dto) 3 ] undergoes the CTPT between
200 and 60 K. In order to determine the critical temperature (T CT ) of CTPT,
57 Fe
Mössbauer spectroscopy was carried out in the temperature range between 130 and
90 K. As shown in Fig. 6.19, the HT phase with Fe
II O 6 (S = 2)–Fe
III S 6 (S = 1/2) and
the LT phase with Fe
II S 6 (S = 0)–Fe
III O 6 (S = 5/2) are clearly distinguished in the
vicinity of CTPT, which implies that the frequency of electron transfer between the
Fe
II and Fe
III sites at the CTPT is at least slower than the time scale (10
−7 s) of
57 Fe
Mössbauer spectroscopy. When the temperature decreases from 130 to 90 K, the
fractions of HT and LT phases decreases and increases, respectively. The crossing
285
Fig. 6.17 Schematic representation of the photo-induced magnet for Rb 0.66 Co 1.25
[Fe(CN) 6 ]·4.3H 2 O
[39]. As shown in Fig. 6.18, the line profile of the
57 Fe Mössbauer spectra of (nC 3 H 7 ) 4 N[
57 Fe
II Fe
III (dto) 3 ] dramatically changes between 200 and 60 K. The intensity of the dominant doublet corresponding to the Fe
II (S = 2) site decreases and a
new doublet with IS = 0.55 mm s
−1 and QS = 0.91 mm s
−1 appears. The IS and
QS values of the new doublet are quite similar to those (IS = 0.49 mm s
−1 , QS
= 0.68 mm s
−1 ) of the
57 Fe Mössbauer spectrum for the Fe
III
(t
3
2g e
2
g , S = 5/2) site
in (n-C 4 H 9 ) 4 N[Ni
II Fe
III (ox) 3 ] at 78 K [40]. On the other hand, in the case of (nC 3 H 7 ) 4 N[Fe
II 57 Fe
III (dto) 3 ] at 200 K, the dominant doublet with IS = 0.33 mm s
−1
and QS = 0.36 mm s
−1 is assigned to the Fe
III
(t
5
2g , S = 1/2) site coordinated by six
S atoms. These values of IS and QS are quite similar to those (IS = 0.33 mm s
−1 ,
QS = 0.35 mm s
−1 at 196 K) for the Fe
III
(t
5
2g , S = 1/2) site coordinated by six S
atoms in KBa[Fe
III (dto) 3 ] [41]. On the other hand, the dominant doublet with IS =
0.41 mm s
−1 and QS = 0.51 mm s
−1 at 60 K is assigned to the Fe
II
(t
6
2g , S = 0) site
coordinated by six S atoms. These IS and QS values are quite similar to those (IS =
0.41 mm s
−1 , QS = 0.64 mms
−1 at 77 K) for the Fe
II
(t
6
2g , S = 0) site coordinated by
six S atoms in pyrite (FeS 2 ) [42]. In this manner, we have elucidated the CTPT for
(n-C 3 H 7 ) 4 N[Fe
II Fe
III (dto) 3 ] by means of
57 Fe Mössbauer spectroscopy.
As mentioned above, (n-C 3 H 7 ) 4 N[Fe
II Fe
III (dto) 3 ] undergoes the CTPT between
200 and 60 K. In order to determine the critical temperature (T CT ) of CTPT,
57 Fe
Mössbauer spectroscopy was carried out in the temperature range between 130 and
90 K. As shown in Fig. 6.19, the HT phase with Fe
II O 6 (S = 2)–Fe
III S 6 (S = 1/2) and
the LT phase with Fe
II S 6 (S = 0)–Fe
III O 6 (S = 5/2) are clearly distinguished in the
vicinity of CTPT, which implies that the frequency of electron transfer between the
Fe
II and Fe
III sites at the CTPT is at least slower than the time scale (10
−7 s) of
57 Fe
Mössbauer spectroscopy. When the temperature decreases from 130 to 90 K, the
fractions of HT and LT phases decreases and increases, respectively. The crossing