

232
C. McCammon
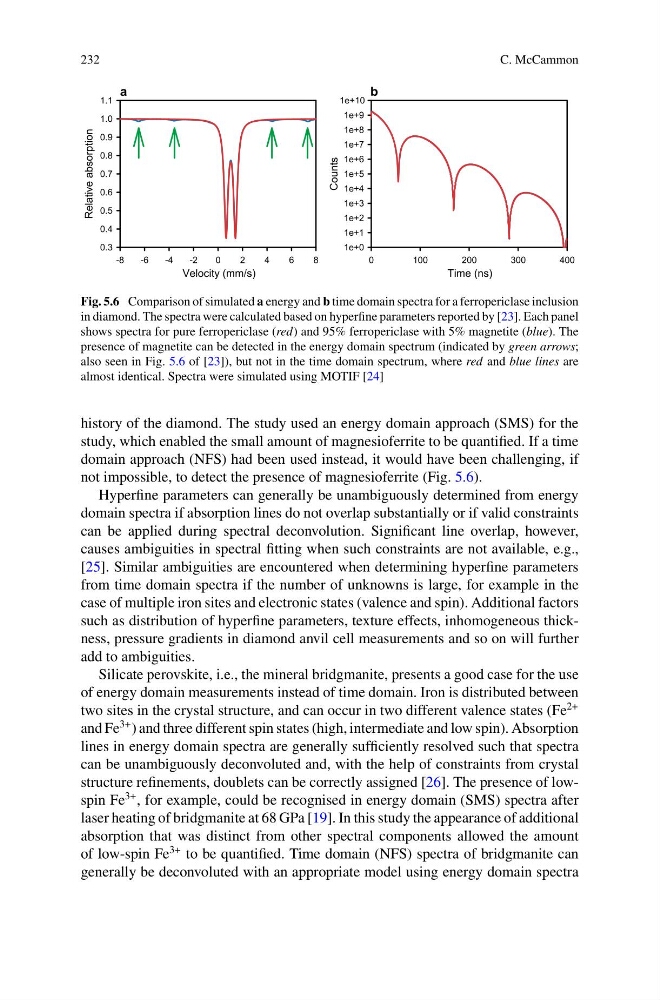
Fig. 5.6 Comparison of simulated a energy and b time domain spectra for a ferropericlase inclusion
in diamond. The spectra were calculated based on hyperfine parameters reported by [23]. Each panel
shows spectra for pure ferropericlase (red) and 95% ferropericlase with 5% magnetite (blue). The
presence of magnetite can be detected in the energy domain spectrum (indicated by green arrows;
also seen in Fig. 5.6 of [23]), but not in the time domain spectrum, where red and blue lines are
almost identical. Spectra were simulated using MOTIF [24]
history of the diamond. The study used an energy domain approach (SMS) for the
study, which enabled the small amount of magnesioferrite to be quantified. If a time
domain approach (NFS) had been used instead, it would have been challenging, if
not impossible, to detect the presence of magnesioferrite (Fig. 5.6).
Hyperfine parameters can generally be unambiguously determined from energy
domain spectra if absorption lines do not overlap substantially or if valid constraints
can be applied during spectral deconvolution. Significant line overlap, however,
causes ambiguities in spectral fitting when such constraints are not available, e.g.,
[25]. Similar ambiguities are encountered when determining hyperfine parameters
from time domain spectra if the number of unknowns is large, for example in the
case of multiple iron sites and electronic states (valence and spin). Additional factors
such as distribution of hyperfine parameters, texture effects, inhomogeneous thickness, pressure gradients in diamond anvil cell measurements and so on will further
add to ambiguities.
Silicate perovskite, i.e., the mineral bridgmanite, presents a good case for the use
of energy domain measurements instead of time domain. Iron is distributed between
two sites in the crystal structure, and can occur in two different valence states (Fe
2+
and Fe
3+ ) and three different spin states (high, intermediate and low spin). Absorption
lines in energy domain spectra are generally sufficiently resolved such that spectra
can be unambiguously deconvoluted and, with the help of constraints from crystal
structure refinements, doublets can be correctly assigned [26]. The presence of lowspin Fe
3+ , for example, could be recognised in energy domain (SMS) spectra after
laser heating of bridgmanite at 68 GPa [19]. In this study the appearance of additional
absorption that was distinct from other spectral components allowed the amount
of low-spin Fe
3+ to be quantified. Time domain (NFS) spectra of bridgmanite can
generally be deconvoluted with an appropriate model using energy domain spectra
C. McCammon
Fig. 5.6 Comparison of simulated a energy and b time domain spectra for a ferropericlase inclusion
in diamond. The spectra were calculated based on hyperfine parameters reported by [23]. Each panel
shows spectra for pure ferropericlase (red) and 95% ferropericlase with 5% magnetite (blue). The
presence of magnetite can be detected in the energy domain spectrum (indicated by green arrows;
also seen in Fig. 5.6 of [23]), but not in the time domain spectrum, where red and blue lines are
almost identical. Spectra were simulated using MOTIF [24]
history of the diamond. The study used an energy domain approach (SMS) for the
study, which enabled the small amount of magnesioferrite to be quantified. If a time
domain approach (NFS) had been used instead, it would have been challenging, if
not impossible, to detect the presence of magnesioferrite (Fig. 5.6).
Hyperfine parameters can generally be unambiguously determined from energy
domain spectra if absorption lines do not overlap substantially or if valid constraints
can be applied during spectral deconvolution. Significant line overlap, however,
causes ambiguities in spectral fitting when such constraints are not available, e.g.,
[25]. Similar ambiguities are encountered when determining hyperfine parameters
from time domain spectra if the number of unknowns is large, for example in the
case of multiple iron sites and electronic states (valence and spin). Additional factors
such as distribution of hyperfine parameters, texture effects, inhomogeneous thickness, pressure gradients in diamond anvil cell measurements and so on will further
add to ambiguities.
Silicate perovskite, i.e., the mineral bridgmanite, presents a good case for the use
of energy domain measurements instead of time domain. Iron is distributed between
two sites in the crystal structure, and can occur in two different valence states (Fe
2+
and Fe
3+ ) and three different spin states (high, intermediate and low spin). Absorption
lines in energy domain spectra are generally sufficiently resolved such that spectra
can be unambiguously deconvoluted and, with the help of constraints from crystal
structure refinements, doublets can be correctly assigned [26]. The presence of lowspin Fe
3+ , for example, could be recognised in energy domain (SMS) spectra after
laser heating of bridgmanite at 68 GPa [19]. In this study the appearance of additional
absorption that was distinct from other spectral components allowed the amount
of low-spin Fe
3+ to be quantified. Time domain (NFS) spectra of bridgmanite can
generally be deconvoluted with an appropriate model using energy domain spectra