

3.2 Alkaline solutions
57
-0.7
-0.6
-0.5
-0.4
-0.3
-0.2
-0.1
0.0
0.1
0.2
-3. 0x10
-3
-2. 0x10
-3
-1. 0x10
-3
0. 0
1. 0x10
-3
2. 0x10
-3
3. 0x10
-3
4. 0x10
-3
simulation
experimental
m(t)
(A* cm
-2
)
1/ 2
E/ V
0. 0
2. 0x10
-4
4. 0x10
-4
6. 0x10
-4
8. 0x10
-4
1. 0x10
-3
1. 2x10
-3
diffusion
surface
surface+diffusion
experimental
j / A cm
-2
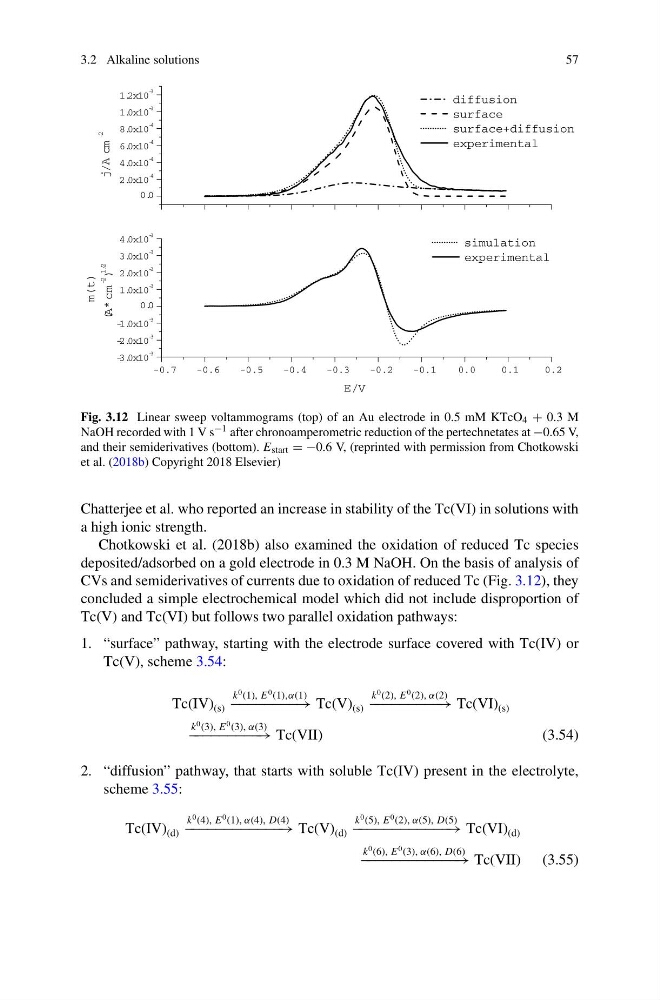
Fig. 3.12 Linear sweep voltammograms (top) of an Au electrode in 0.5 mM KTcO 4 + 0.3 M
NaOH recorded with 1 V s −1 after chronoamperometric reduction of the pertechnetates at −0.65 V,
and their semiderivatives (bottom). E start = −0.6 V, (reprinted with permission from Chotkowski
et al. (2018b) Copyright 2018 Elsevier)
Chatterjee et al. who reported an increase in stability of the Tc(VI) in solutions with
a high ionic strength.
Chotkowski et al. (2018b) also examined the oxidation of reduced Tc species
deposited/adsorbed on a gold electrode in 0.3 M NaOH. On the basis of analysis of
CVs and semiderivatives of currents due to oxidation of reduced Tc (Fig. 3.12), they
concluded a simple electrochemical model which did not include disproportion of
Tc(V) and Tc(VI) but follows two parallel oxidation pathways:
1. “surface” pathway, starting with the electrode surface covered with Tc(IV) or
Tc(V), scheme 3.54:
Tc(IV) (s)
k
0 (1), E
0 (1),α(1)
−−−−−−−−→ Tc(V) (s)
k
0 (2), E
0 (2), α(2)
− −−−−−−−− → Tc(VI) (s)
k
0 (3), E
0 (3), α(3)
− −−−−−−−− → Tc(VII)
(3.54)
2. “diffusion” pathway, that starts with soluble Tc(IV) present in the electrolyte,
scheme 3.55:
Tc(IV) (d)
k
0 (4), E
0 (1), α(4), D(4)
− −−−−−−−−−−− → Tc(V) (d)
k
0 (5), E
0 (2), α(5), D(5)
− −−−−−−−−−−− → Tc(VI) (d)
k
0 (6), E
0 (3), α(6), D(6)
− −−−−−−−−−−− → Tc(VII) (3.55)
57
-0.7
-0.6
-0.5
-0.4
-0.3
-0.2
-0.1
0.0
0.1
0.2
-3. 0x10
-3
-2. 0x10
-3
-1. 0x10
-3
0. 0
1. 0x10
-3
2. 0x10
-3
3. 0x10
-3
4. 0x10
-3
simulation
experimental
m(t)
(A* cm
-2
)
1/ 2
E/ V
0. 0
2. 0x10
-4
4. 0x10
-4
6. 0x10
-4
8. 0x10
-4
1. 0x10
-3
1. 2x10
-3
diffusion
surface
surface+diffusion
experimental
j / A cm
-2
Fig. 3.12 Linear sweep voltammograms (top) of an Au electrode in 0.5 mM KTcO 4 + 0.3 M
NaOH recorded with 1 V s −1 after chronoamperometric reduction of the pertechnetates at −0.65 V,
and their semiderivatives (bottom). E start = −0.6 V, (reprinted with permission from Chotkowski
et al. (2018b) Copyright 2018 Elsevier)
Chatterjee et al. who reported an increase in stability of the Tc(VI) in solutions with
a high ionic strength.
Chotkowski et al. (2018b) also examined the oxidation of reduced Tc species
deposited/adsorbed on a gold electrode in 0.3 M NaOH. On the basis of analysis of
CVs and semiderivatives of currents due to oxidation of reduced Tc (Fig. 3.12), they
concluded a simple electrochemical model which did not include disproportion of
Tc(V) and Tc(VI) but follows two parallel oxidation pathways:
1. “surface” pathway, starting with the electrode surface covered with Tc(IV) or
Tc(V), scheme 3.54:
Tc(IV) (s)
k
0 (1), E
0 (1),α(1)
−−−−−−−−→ Tc(V) (s)
k
0 (2), E
0 (2), α(2)
− −−−−−−−− → Tc(VI) (s)
k
0 (3), E
0 (3), α(3)
− −−−−−−−− → Tc(VII)
(3.54)
2. “diffusion” pathway, that starts with soluble Tc(IV) present in the electrolyte,
scheme 3.55:
Tc(IV) (d)
k
0 (4), E
0 (1), α(4), D(4)
− −−−−−−−−−−− → Tc(V) (d)
k
0 (5), E
0 (2), α(5), D(5)
− −−−−−−−−−−− → Tc(VI) (d)
k
0 (6), E
0 (3), α(6), D(6)
− −−−−−−−−−−− → Tc(VII) (3.55)