

56
3 Technetium Coordinated by Inorganic Ligands in Aqueous …
can be supported by results obtained in acidic solutions by Rotmanov et al. (2015)
but is in contrast to conclusion of Poineau et al. (2013) who connected the Tc(V) to a
significantly different wavelength. Noteworthly is the fact that formation of insoluble
Tc(IV) species leads to an overall increase in the UV–Vis absorbance which may
mask the presence of Tc forms whose absorbance is very low. The number of the
electrons involved in the electrochemical reduction of the pertechnetates determined
by Chotkowski et al. varies from 1.5 to 1.7 being higher than that reported by Chatterjee et al. According to the former authors, this effect confirms the occurrence of the
Tc(VI) disproportion. Additional Au-SERS measurements revealed the formation of
intermediate Tc forms, probably Tc(V), which exhibits a band at 900 cm
−1 . The
shape of the CV curves recorded for TcO
−
4 in alkaline solutions by Chotkowski et al.
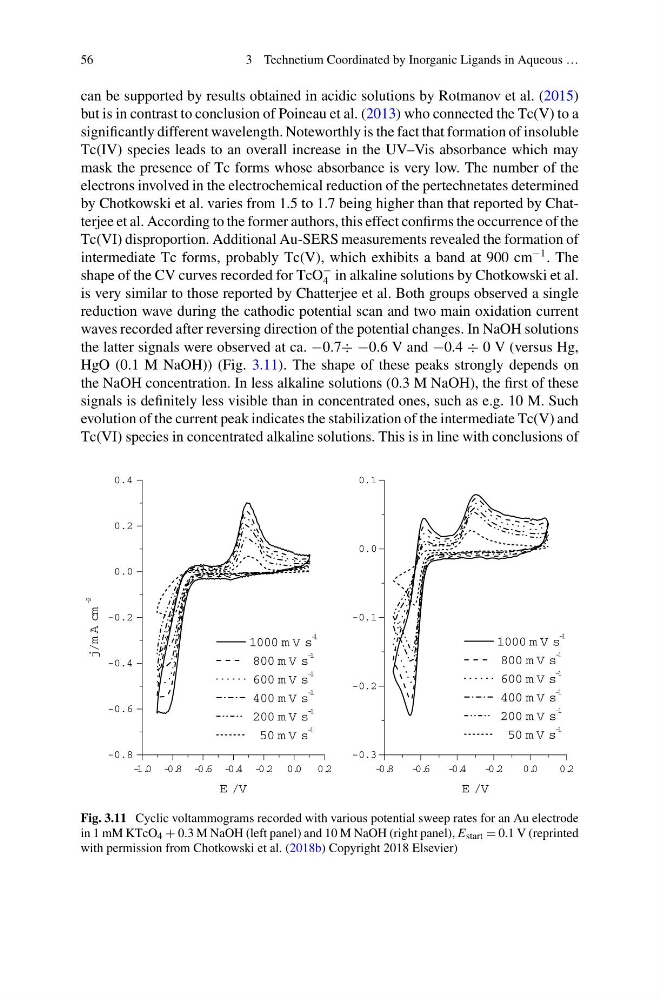
is very similar to those reported by Chatterjee et al. Both groups observed a single
reduction wave during the cathodic potential scan and two main oxidation current
waves recorded after reversing direction of the potential changes. In NaOH solutions
the latter signals were observed at ca. −0.7÷ −0.6 V and −0.4 ÷ 0 V (versus Hg,
HgO (0.1 M NaOH)) (Fig. 3.11). The shape of these peaks strongly depends on
the NaOH concentration. In less alkaline solutions (0.3 M NaOH), the first of these
signals is definitely less visible than in concentrated ones, such as e.g. 10 M. Such
evolution of the current peak indicates the stabilization of the intermediate Tc(V) and
Tc(VI) species in concentrated alkaline solutions. This is in line with conclusions of
-1. 0 - 0. 8 - 0. 6 - 0. 4 - 0. 2 0. 0 0. 2
-0.8
-0.6
-0.4
-0.2
0.0
0.2
0.4
1000 m V s
-1
800 m V s
-1
600 m V s
-1
400 m V s
-1
200 m V s
-1
50 m V s
-1
j / m A cm
-2
E / V
-0. 8
- 0. 6
- 0. 4
- 0. 2
0 . 0
0 . 2
-0.3
-0.2
-0.1
0.0
0.1
1000 m V s
-1
800 m V s
-1
600 m V s
-1
400 m V s
-1
200 m V s
-1
50 m V s
-1
E / V
Fig. 3.11 Cyclic voltammograms recorded with various potential sweep rates for an Au electrode
in 1 mM KTcO 4 + 0.3 M NaOH (left panel) and 10 M NaOH (right panel), E start = 0.1 V (reprinted
with permission from Chotkowski et al. (2018b) Copyright 2018 Elsevier)
3 Technetium Coordinated by Inorganic Ligands in Aqueous …
can be supported by results obtained in acidic solutions by Rotmanov et al. (2015)
but is in contrast to conclusion of Poineau et al. (2013) who connected the Tc(V) to a
significantly different wavelength. Noteworthly is the fact that formation of insoluble
Tc(IV) species leads to an overall increase in the UV–Vis absorbance which may
mask the presence of Tc forms whose absorbance is very low. The number of the
electrons involved in the electrochemical reduction of the pertechnetates determined
by Chotkowski et al. varies from 1.5 to 1.7 being higher than that reported by Chatterjee et al. According to the former authors, this effect confirms the occurrence of the
Tc(VI) disproportion. Additional Au-SERS measurements revealed the formation of
intermediate Tc forms, probably Tc(V), which exhibits a band at 900 cm
−1 . The
shape of the CV curves recorded for TcO
−
4 in alkaline solutions by Chotkowski et al.
is very similar to those reported by Chatterjee et al. Both groups observed a single
reduction wave during the cathodic potential scan and two main oxidation current
waves recorded after reversing direction of the potential changes. In NaOH solutions
the latter signals were observed at ca. −0.7÷ −0.6 V and −0.4 ÷ 0 V (versus Hg,
HgO (0.1 M NaOH)) (Fig. 3.11). The shape of these peaks strongly depends on
the NaOH concentration. In less alkaline solutions (0.3 M NaOH), the first of these
signals is definitely less visible than in concentrated ones, such as e.g. 10 M. Such
evolution of the current peak indicates the stabilization of the intermediate Tc(V) and
Tc(VI) species in concentrated alkaline solutions. This is in line with conclusions of
-1. 0 - 0. 8 - 0. 6 - 0. 4 - 0. 2 0. 0 0. 2
-0.8
-0.6
-0.4
-0.2
0.0
0.2
0.4
1000 m V s
-1
800 m V s
-1
600 m V s
-1
400 m V s
-1
200 m V s
-1
50 m V s
-1
j / m A cm
-2
E / V
-0. 8
- 0. 6
- 0. 4
- 0. 2
0 . 0
0 . 2
-0.3
-0.2
-0.1
0.0
0.1
1000 m V s
-1
800 m V s
-1
600 m V s
-1
400 m V s
-1
200 m V s
-1
50 m V s
-1
E / V
Fig. 3.11 Cyclic voltammograms recorded with various potential sweep rates for an Au electrode
in 1 mM KTcO 4 + 0.3 M NaOH (left panel) and 10 M NaOH (right panel), E start = 0.1 V (reprinted
with permission from Chotkowski et al. (2018b) Copyright 2018 Elsevier)