

3.2 Alkaline solutions
55
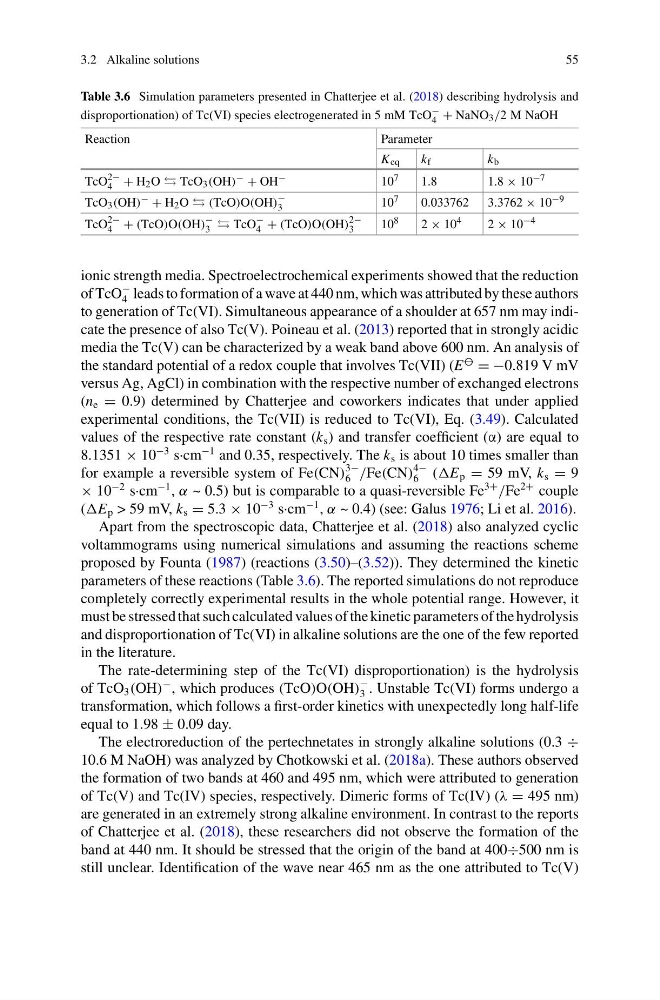
Table 3.6 Simulation parameters presented in Chatterjee et al. (2018) describing hydrolysis and
disproportionation) of Tc(VI) species electrogenerated in 5 mM TcO
−
4 + NaNO 3 /2 M NaOH
Reaction
Parameter
K eq
k f
k b
TcO
2−
4 + H 2 O TcO 3 (OH) − + OH −
10 7
1.8
1.8 × 10 −7
TcO 3 (OH) − + H 2 O (TcO)O(OH)
−
3
10 7
0.033762 3.3762 × 10 −9
TcO
2−
4 + (TcO)O(OH)
−
3 TcO
−
4 + (TcO)O(OH)
2−
3
10 8
2 × 10 4
2 × 10 −4
ionic strength media. Spectroelectrochemical experiments showed that the reduction
of TcO
−
4 leads to formation of a wave at 440 nm, which was attributed by these authors
to generation of Tc(VI). Simultaneous appearance of a shoulder at 657 nm may indicate the presence of also Tc(V). Poineau et al. (2013) reported that in strongly acidic
media the Tc(V) can be characterized by a weak band above 600 nm. An analysis of
the standard potential of a redox couple that involves Tc(VII) (E
⦵
= −0.819 V mV
versus Ag, AgCl) in combination with the respective number of exchanged electrons
(n e = 0.9) determined by Chatterjee and coworkers indicates that under applied
experimental conditions, the Tc(VII) is reduced to Tc(VI), Eq. (3.49). Calculated
values of the respective rate constant (k s ) and transfer coefficient (α) are equal to
8.1351 × 10
−3 s·cm
−1 and 0.35, respectively. The k s is about 10 times smaller than
for example a reversible system of Fe(CN)
3−
6 /Fe(CN)
4−
6 (E p = 59 mV, k s = 9
× 10
−2 s·cm
−1 , α ~ 0.5) but is comparable to a quasi-reversible Fe
3+
/Fe
2+ couple
(E p > 59 mV, k s = 5.3 × 10
−3 s·cm
−1 , α ~ 0.4) (see: Galus 1976; Li et al. 2016).
Apart from the spectroscopic data, Chatterjee et al. (2018) also analyzed cyclic
voltammograms using numerical simulations and assuming the reactions scheme
proposed by Founta (1987) (reactions (3.50)–(3.52)). They determined the kinetic
parameters of these reactions (Table 3.6). The reported simulations do not reproduce
completely correctly experimental results in the whole potential range. However, it
must be stressed that such calculated values of the kinetic parameters of the hydrolysis
and disproportionation of Tc(VI) in alkaline solutions are the one of the few reported
in the literature.
The rate-determining step of the Tc(VI) disproportionation) is the hydrolysis
of TcO 3 (OH)
− , which produces (TcO)O(OH)
−
3 . Unstable Tc(VI) forms undergo a
transformation, which follows a first-order kinetics with unexpectedly long half-life
equal to 1.98 ± 0.09 day.
The electroreduction of the pertechnetates in strongly alkaline solutions (0.3 ÷
10.6 M NaOH) was analyzed by Chotkowski et al. (2018a). These authors observed
the formation of two bands at 460 and 495 nm, which were attributed to generation
of Tc(V) and Tc(IV) species, respectively. Dimeric forms of Tc(IV) (λ = 495 nm)
are generated in an extremely strong alkaline environment. In contrast to the reports
of Chatterjee et al. (2018), these researchers did not observe the formation of the
band at 440 nm. It should be stressed that the origin of the band at 400÷500 nm is
still unclear. Identification of the wave near 465 nm as the one attributed to Tc(V)
55
Table 3.6 Simulation parameters presented in Chatterjee et al. (2018) describing hydrolysis and
disproportionation) of Tc(VI) species electrogenerated in 5 mM TcO
−
4 + NaNO 3 /2 M NaOH
Reaction
Parameter
K eq
k f
k b
TcO
2−
4 + H 2 O TcO 3 (OH) − + OH −
10 7
1.8
1.8 × 10 −7
TcO 3 (OH) − + H 2 O (TcO)O(OH)
−
3
10 7
0.033762 3.3762 × 10 −9
TcO
2−
4 + (TcO)O(OH)
−
3 TcO
−
4 + (TcO)O(OH)
2−
3
10 8
2 × 10 4
2 × 10 −4
ionic strength media. Spectroelectrochemical experiments showed that the reduction
of TcO
−
4 leads to formation of a wave at 440 nm, which was attributed by these authors
to generation of Tc(VI). Simultaneous appearance of a shoulder at 657 nm may indicate the presence of also Tc(V). Poineau et al. (2013) reported that in strongly acidic
media the Tc(V) can be characterized by a weak band above 600 nm. An analysis of
the standard potential of a redox couple that involves Tc(VII) (E
⦵
= −0.819 V mV
versus Ag, AgCl) in combination with the respective number of exchanged electrons
(n e = 0.9) determined by Chatterjee and coworkers indicates that under applied
experimental conditions, the Tc(VII) is reduced to Tc(VI), Eq. (3.49). Calculated
values of the respective rate constant (k s ) and transfer coefficient (α) are equal to
8.1351 × 10
−3 s·cm
−1 and 0.35, respectively. The k s is about 10 times smaller than
for example a reversible system of Fe(CN)
3−
6 /Fe(CN)
4−
6 (E p = 59 mV, k s = 9
× 10
−2 s·cm
−1 , α ~ 0.5) but is comparable to a quasi-reversible Fe
3+
/Fe
2+ couple
(E p > 59 mV, k s = 5.3 × 10
−3 s·cm
−1 , α ~ 0.4) (see: Galus 1976; Li et al. 2016).
Apart from the spectroscopic data, Chatterjee et al. (2018) also analyzed cyclic
voltammograms using numerical simulations and assuming the reactions scheme
proposed by Founta (1987) (reactions (3.50)–(3.52)). They determined the kinetic
parameters of these reactions (Table 3.6). The reported simulations do not reproduce
completely correctly experimental results in the whole potential range. However, it
must be stressed that such calculated values of the kinetic parameters of the hydrolysis
and disproportionation of Tc(VI) in alkaline solutions are the one of the few reported
in the literature.
The rate-determining step of the Tc(VI) disproportionation) is the hydrolysis
of TcO 3 (OH)
− , which produces (TcO)O(OH)
−
3 . Unstable Tc(VI) forms undergo a
transformation, which follows a first-order kinetics with unexpectedly long half-life
equal to 1.98 ± 0.09 day.
The electroreduction of the pertechnetates in strongly alkaline solutions (0.3 ÷
10.6 M NaOH) was analyzed by Chotkowski et al. (2018a). These authors observed
the formation of two bands at 460 and 495 nm, which were attributed to generation
of Tc(V) and Tc(IV) species, respectively. Dimeric forms of Tc(IV) (λ = 495 nm)
are generated in an extremely strong alkaline environment. In contrast to the reports
of Chatterjee et al. (2018), these researchers did not observe the formation of the
band at 440 nm. It should be stressed that the origin of the band at 400÷500 nm is
still unclear. Identification of the wave near 465 nm as the one attributed to Tc(V)