

6.2 Alkaline Solutions
151
· 10
−7 mol dm
−3 . The second oxidation peak observed at −0.2 V allowed to determine the technetium at the concentration range from 10
−4 to 4 · 10
−6 mol dm
−3 . The
authors stated that an 10
4 fold excess of ReO 4
− or MoO 4
2 − ions did not interfere
with the Tc determination when the content of the latter was equal to at least 0.5 μg.
A different approach to the analysis of the traces of the technetium was proposed
by El-Reefy et al. (El-Reefy 1990). These researchers used the technetium extraction
as one of the steps in the process of determination of this element. They utilized the
fact that tetraphenylarsonium strongly extracts the TcO
−
4 from an alkaline or a slightly
acidic aqueous phase to a chloform-based organic phase. The extraction process was
carried out for 10 min. using the aqueous phase containing 0.01 M HCl and Tc(VII)
while the organic phase was composed of 10 mM tetraphenylarsonium dissolved in
chloroform. The volume ratio of the organic to the aqueous phase was equal to 1:3.
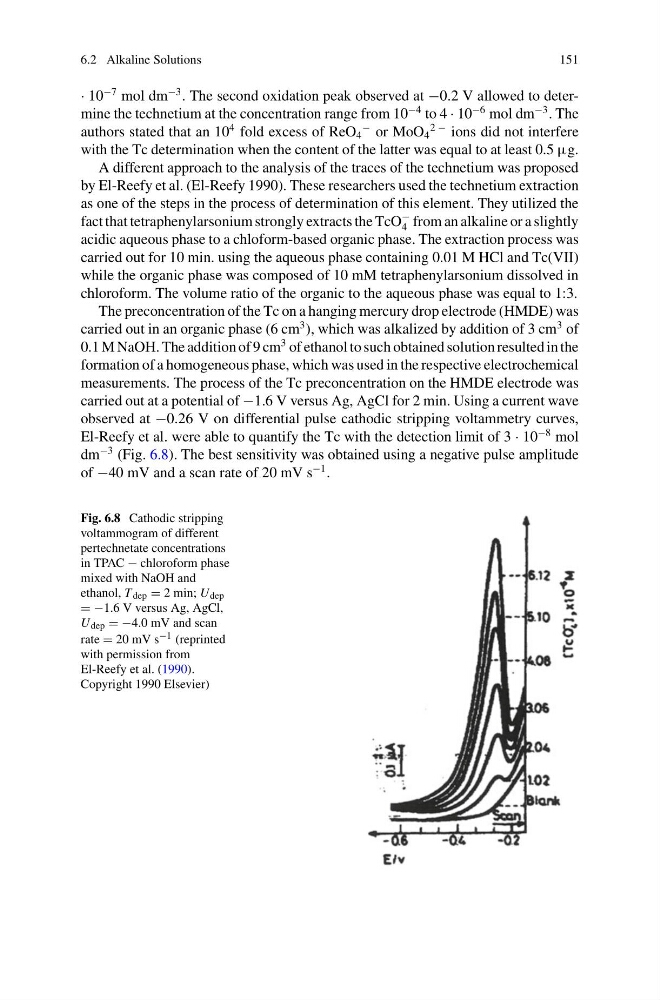
The preconcentration of the Tc on a hanging mercury drop electrode (HMDE) was
carried out in an organic phase (6 cm
3 ), which was alkalized by addition of 3 cm
3 of
0.1 M NaOH. The addition of 9 cm
3 of ethanol to such obtained solution resulted in the
formation of a homogeneous phase, which was used in the respective electrochemical
measurements. The process of the Tc preconcentration on the HMDE electrode was
carried out at a potential of −1.6 V versus Ag, AgCl for 2 min. Using a current wave
observed at −0.26 V on differential pulse cathodic stripping voltammetry curves,
El-Reefy et al. were able to quantify the Tc with the detection limit of 3 · 10
−8 mol
dm
−3 (Fig. 6.8). The best sensitivity was obtained using a negative pulse amplitude
of −40 mV and a scan rate of 20 mV s
−1 .
Fig. 6.8 Cathodic stripping
voltammogram of different
pertechnetate concentrations
in TPAC − chloroform phase
mixed with NaOH and
ethanol, T dep = 2 min; U dep
= −1.6 V versus Ag, AgCl,
U dep = −4.0 mV and scan
rate = 20 mV s −1 (reprinted
with permission from
El-Reefy et al. (1990).
Copyright 1990 Elsevier)
151
· 10
−7 mol dm
−3 . The second oxidation peak observed at −0.2 V allowed to determine the technetium at the concentration range from 10
−4 to 4 · 10
−6 mol dm
−3 . The
authors stated that an 10
4 fold excess of ReO 4
− or MoO 4
2 − ions did not interfere
with the Tc determination when the content of the latter was equal to at least 0.5 μg.
A different approach to the analysis of the traces of the technetium was proposed
by El-Reefy et al. (El-Reefy 1990). These researchers used the technetium extraction
as one of the steps in the process of determination of this element. They utilized the
fact that tetraphenylarsonium strongly extracts the TcO
−
4 from an alkaline or a slightly
acidic aqueous phase to a chloform-based organic phase. The extraction process was
carried out for 10 min. using the aqueous phase containing 0.01 M HCl and Tc(VII)
while the organic phase was composed of 10 mM tetraphenylarsonium dissolved in
chloroform. The volume ratio of the organic to the aqueous phase was equal to 1:3.
The preconcentration of the Tc on a hanging mercury drop electrode (HMDE) was
carried out in an organic phase (6 cm
3 ), which was alkalized by addition of 3 cm
3 of
0.1 M NaOH. The addition of 9 cm
3 of ethanol to such obtained solution resulted in the
formation of a homogeneous phase, which was used in the respective electrochemical
measurements. The process of the Tc preconcentration on the HMDE electrode was
carried out at a potential of −1.6 V versus Ag, AgCl for 2 min. Using a current wave
observed at −0.26 V on differential pulse cathodic stripping voltammetry curves,
El-Reefy et al. were able to quantify the Tc with the detection limit of 3 · 10
−8 mol
dm
−3 (Fig. 6.8). The best sensitivity was obtained using a negative pulse amplitude
of −40 mV and a scan rate of 20 mV s
−1 .
Fig. 6.8 Cathodic stripping
voltammogram of different
pertechnetate concentrations
in TPAC − chloroform phase
mixed with NaOH and
ethanol, T dep = 2 min; U dep
= −1.6 V versus Ag, AgCl,
U dep = −4.0 mV and scan
rate = 20 mV s −1 (reprinted
with permission from
El-Reefy et al. (1990).
Copyright 1990 Elsevier)