

150
6 Determination of Trace Amounts of Tc by Electrochemical Methods
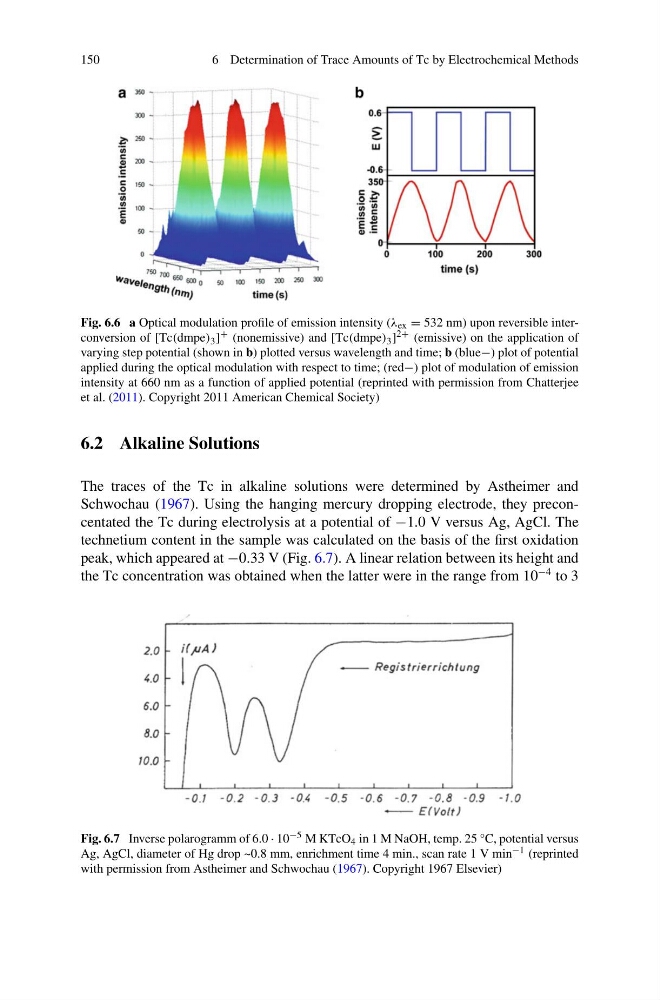
Fig. 6.6 a Optical modulation profile of emission intensity (λ ex = 532 nm) upon reversible interconversion of [Tc(dmpe) 3 ] + (nonemissive) and [Tc(dmpe) 3 ] 2+ (emissive) on the application of
varying step potential (shown in b) plotted versus wavelength and time; b (blue−) plot of potential
applied during the optical modulation with respect to time; (red−) plot of modulation of emission
intensity at 660 nm as a function of applied potential (reprinted with permission from Chatterjee
et al. (2011). Copyright 2011 American Chemical Society)
6.2 Alkaline Solutions
The traces of the Tc in alkaline solutions were determined by Astheimer and
Schwochau (1967). Using the hanging mercury dropping electrode, they preconcentated the Tc during electrolysis at a potential of −1.0 V versus Ag, AgCl. The
technetium content in the sample was calculated on the basis of the first oxidation
peak, which appeared at −0.33 V (Fig. 6.7). A linear relation between its height and
the Tc concentration was obtained when the latter were in the range from 10
−4 to 3
Fig. 6.7 Inverse polarogramm of 6.0 · 10 −5 M KTcO 4 in 1 M NaOH, temp. 25 °C, potential versus
Ag, AgCl, diameter of Hg drop ~0.8 mm, enrichment time 4 min., scan rate 1 V min −1 (reprinted
with permission from Astheimer and Schwochau (1967). Copyright 1967 Elsevier)
6 Determination of Trace Amounts of Tc by Electrochemical Methods
Fig. 6.6 a Optical modulation profile of emission intensity (λ ex = 532 nm) upon reversible interconversion of [Tc(dmpe) 3 ] + (nonemissive) and [Tc(dmpe) 3 ] 2+ (emissive) on the application of
varying step potential (shown in b) plotted versus wavelength and time; b (blue−) plot of potential
applied during the optical modulation with respect to time; (red−) plot of modulation of emission
intensity at 660 nm as a function of applied potential (reprinted with permission from Chatterjee
et al. (2011). Copyright 2011 American Chemical Society)
6.2 Alkaline Solutions
The traces of the Tc in alkaline solutions were determined by Astheimer and
Schwochau (1967). Using the hanging mercury dropping electrode, they preconcentated the Tc during electrolysis at a potential of −1.0 V versus Ag, AgCl. The
technetium content in the sample was calculated on the basis of the first oxidation
peak, which appeared at −0.33 V (Fig. 6.7). A linear relation between its height and
the Tc concentration was obtained when the latter were in the range from 10
−4 to 3
Fig. 6.7 Inverse polarogramm of 6.0 · 10 −5 M KTcO 4 in 1 M NaOH, temp. 25 °C, potential versus
Ag, AgCl, diameter of Hg drop ~0.8 mm, enrichment time 4 min., scan rate 1 V min −1 (reprinted
with permission from Astheimer and Schwochau (1967). Copyright 1967 Elsevier)