

40
O. Farinre et al.
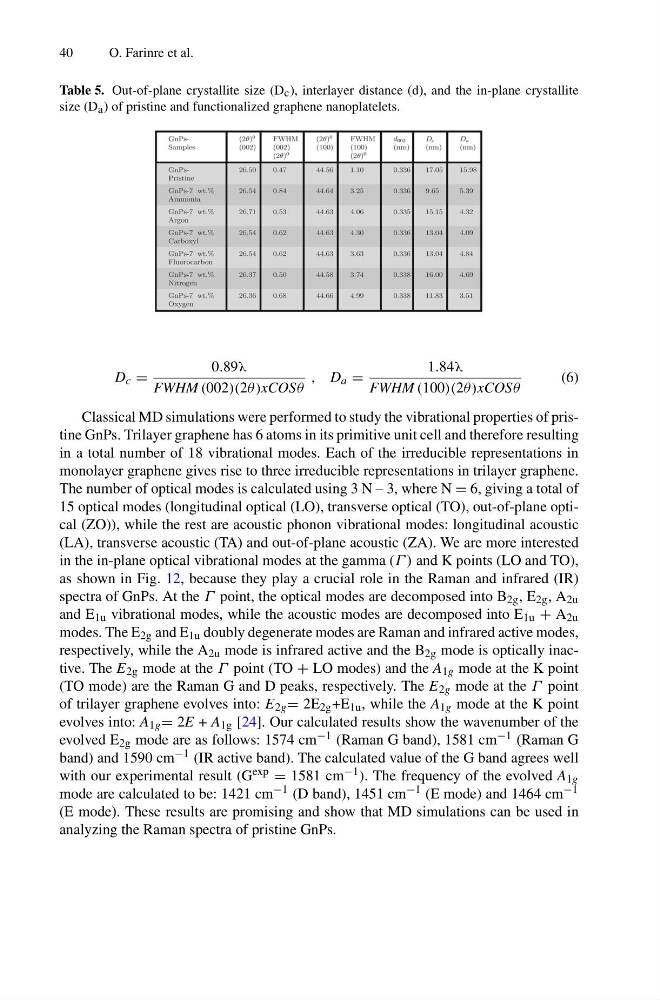
Table 5. Out-of-plane crystallite size (D c ), interlayer distance (d), and the in-plane crystallite
size (D a ) of pristine and functionalized graphene nanoplatelets.
D c =
0.89λ
FWHM (002)(2θ )xCOSθ
, D a =
1.84λ
FWHM (100)(2θ )xCOSθ
(6)
Classical MD simulations were performed to study the vibrational properties of pristine GnPs. Trilayer graphene has 6 atoms in its primitive unit cell and therefore resulting
in a total number of 18 vibrational modes. Each of the irreducible representations in
monolayer graphene gives rise to three irreducible representations in trilayer graphene.
The number of optical modes is calculated using 3 N – 3, where N = 6, giving a total of
15 optical modes (longitudinal optical (LO), transverse optical (TO), out-of-plane optical (ZO)), while the rest are acoustic phonon vibrational modes: longitudinal acoustic
(LA), transverse acoustic (TA) and out-of-plane acoustic (ZA). We are more interested
in the in-plane optical vibrational modes at the gamma (Γ ) and K points (LO and TO),
as shown in Fig. 12, because they play a crucial role in the Raman and infrared (IR)
spectra of GnPs. At the Γ point, the optical modes are decomposed into B 2g , E 2g , A 2u
and E 1u vibrational modes, while the acoustic modes are decomposed into E 1u + A 2u
modes. The E 2g and E 1u doubly degenerate modes are Raman and infrared active modes,
respectively, while the A 2u mode is infrared active and the B 2g mode is optically inactive. The E 2g mode at the Γ point (TO + LO modes) and the A 1g mode at the K point
(TO mode) are the Raman G and D peaks, respectively. The E 2g mode at the Γ point
of trilayer graphene evolves into: E 2g = 2E 2g +E 1u , while the A 1g mode at the K point
evolves into: A 1g = 2E + A 1g [24]. Our calculated results show the wavenumber of the
evolved E 2g mode are as follows: 1574 cm −1 (Raman G band), 1581 cm −1 (Raman G
band) and 1590 cm −1 (IR active band). The calculated value of the G band agrees well
with our experimental result (G exp = 1581 cm −1 ). The frequency of the evolved A 1g
mode are calculated to be: 1421 cm −1 (D band), 1451 cm −1 (E mode) and 1464 cm −1
(E mode). These results are promising and show that MD simulations can be used in
analyzing the Raman spectra of pristine GnPs.
O. Farinre et al.
Table 5. Out-of-plane crystallite size (D c ), interlayer distance (d), and the in-plane crystallite
size (D a ) of pristine and functionalized graphene nanoplatelets.
D c =
0.89λ
FWHM (002)(2θ )xCOSθ
, D a =
1.84λ
FWHM (100)(2θ )xCOSθ
(6)
Classical MD simulations were performed to study the vibrational properties of pristine GnPs. Trilayer graphene has 6 atoms in its primitive unit cell and therefore resulting
in a total number of 18 vibrational modes. Each of the irreducible representations in
monolayer graphene gives rise to three irreducible representations in trilayer graphene.
The number of optical modes is calculated using 3 N – 3, where N = 6, giving a total of
15 optical modes (longitudinal optical (LO), transverse optical (TO), out-of-plane optical (ZO)), while the rest are acoustic phonon vibrational modes: longitudinal acoustic
(LA), transverse acoustic (TA) and out-of-plane acoustic (ZA). We are more interested
in the in-plane optical vibrational modes at the gamma (Γ ) and K points (LO and TO),
as shown in Fig. 12, because they play a crucial role in the Raman and infrared (IR)
spectra of GnPs. At the Γ point, the optical modes are decomposed into B 2g , E 2g , A 2u
and E 1u vibrational modes, while the acoustic modes are decomposed into E 1u + A 2u
modes. The E 2g and E 1u doubly degenerate modes are Raman and infrared active modes,
respectively, while the A 2u mode is infrared active and the B 2g mode is optically inactive. The E 2g mode at the Γ point (TO + LO modes) and the A 1g mode at the K point
(TO mode) are the Raman G and D peaks, respectively. The E 2g mode at the Γ point
of trilayer graphene evolves into: E 2g = 2E 2g +E 1u , while the A 1g mode at the K point
evolves into: A 1g = 2E + A 1g [24]. Our calculated results show the wavenumber of the
evolved E 2g mode are as follows: 1574 cm −1 (Raman G band), 1581 cm −1 (Raman G
band) and 1590 cm −1 (IR active band). The calculated value of the G band agrees well
with our experimental result (G exp = 1581 cm −1 ). The frequency of the evolved A 1g
mode are calculated to be: 1421 cm −1 (D band), 1451 cm −1 (E mode) and 1464 cm −1
(E mode). These results are promising and show that MD simulations can be used in
analyzing the Raman spectra of pristine GnPs.