

Spectroscopic Characterization and Molecular Dynamics Simulation
39
Table 4. Average intensity ratio (I D /I G ) of the D and G bands, along with experimental
uncertainties, for pristine and functionalized graphene nanoplatelets.
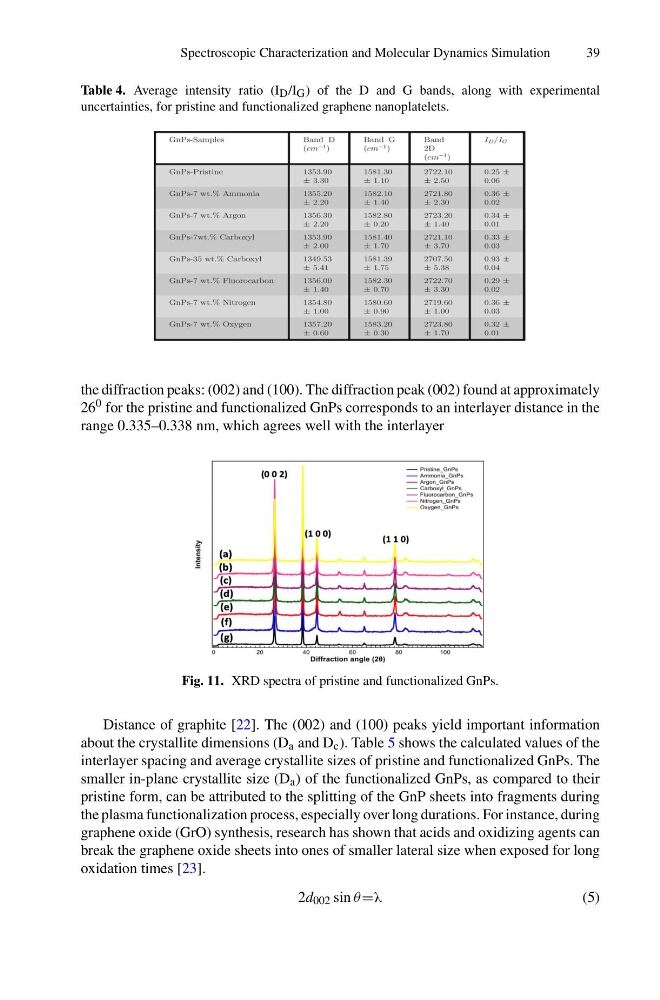
the diffraction peaks: (002) and (100). The diffraction peak (002) found at approximately
26 0 for the pristine and functionalized GnPs corresponds to an interlayer distance in the
range 0.335–0.338 nm, which agrees well with the interlayer
Fig. 11. XRD spectra of pristine and functionalized GnPs.
Distance of graphite [22]. The (002) and (100) peaks yield important information
about the crystallite dimensions (D a and D c ). Table 5 shows the calculated values of the
interlayer spacing and average crystallite sizes of pristine and functionalized GnPs. The
smaller in-plane crystallite size (D a ) of the functionalized GnPs, as compared to their
pristine form, can be attributed to the splitting of the GnP sheets into fragments during
the plasma functionalization process, especially over long durations. For instance, during
graphene oxide (GrO) synthesis, research has shown that acids and oxidizing agents can
break the graphene oxide sheets into ones of smaller lateral size when exposed for long
oxidation times [23].
2d 002 sin θ =λ
(5)
39
Table 4. Average intensity ratio (I D /I G ) of the D and G bands, along with experimental
uncertainties, for pristine and functionalized graphene nanoplatelets.
the diffraction peaks: (002) and (100). The diffraction peak (002) found at approximately
26 0 for the pristine and functionalized GnPs corresponds to an interlayer distance in the
range 0.335–0.338 nm, which agrees well with the interlayer
Fig. 11. XRD spectra of pristine and functionalized GnPs.
Distance of graphite [22]. The (002) and (100) peaks yield important information
about the crystallite dimensions (D a and D c ). Table 5 shows the calculated values of the
interlayer spacing and average crystallite sizes of pristine and functionalized GnPs. The
smaller in-plane crystallite size (D a ) of the functionalized GnPs, as compared to their
pristine form, can be attributed to the splitting of the GnP sheets into fragments during
the plasma functionalization process, especially over long durations. For instance, during
graphene oxide (GrO) synthesis, research has shown that acids and oxidizing agents can
break the graphene oxide sheets into ones of smaller lateral size when exposed for long
oxidation times [23].
2d 002 sin θ =λ
(5)