

176
M. Cao et al.
Table 1. Pressure parameters of permeability test
Depth/m
Axial pressure/MPa
Confining
pressure/MPa
Volumetric
stress/MPa
Pore pressure/MPa
200
5
4
13
1
400
10
8
26
1, 3, 5
600
15
12
39
1, 3, 5, 7, 9
permeability test device according to the settings of different volume stress and pore
pressure conditions in Table 1;
3. After the test is completed, the three large tested specimens and the remaining small
tested specimens are put into the pyrolysis reactor again, heated to 200 °C, and kept
at a constant temperature for 6 h. Repeat step 2 until all permeability and mercury
intrusion tests after pyrolysis with the temperature from 100 °C to 600 °C, are
completed.
3 Results and Discussion
The permeability of oil shale with the temperature
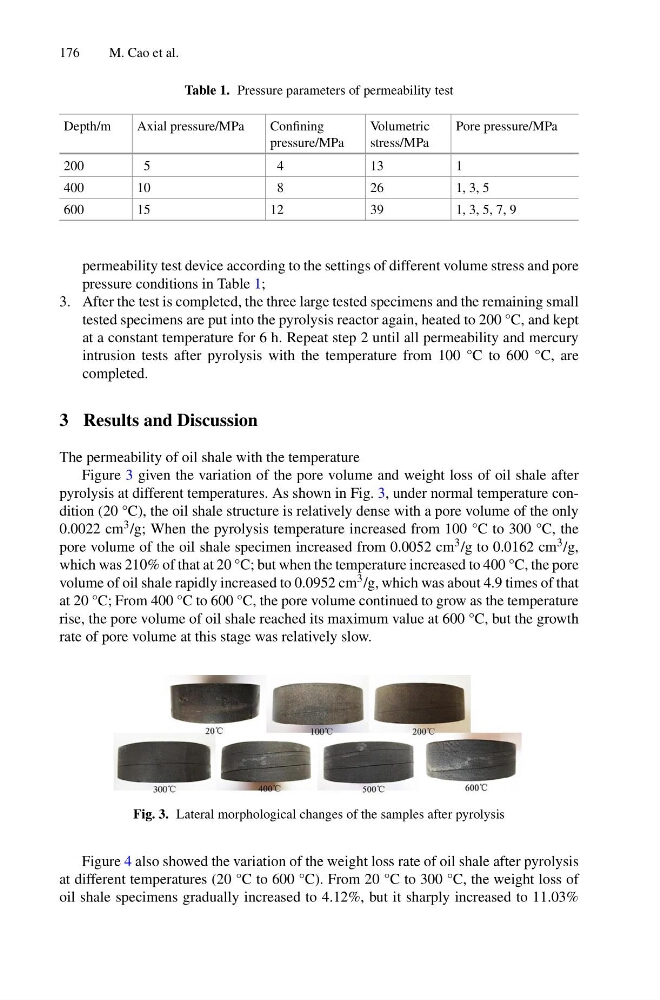
Figure 3 given the variation of the pore volume and weight loss of oil shale after
pyrolysis at different temperatures. As shown in Fig. 3, under normal temperature condition (20 °C), the oil shale structure is relatively dense with a pore volume of the only
0.0022 cm 3 /g; When the pyrolysis temperature increased from 100 °C to 300 °C, the
pore volume of the oil shale specimen increased from 0.0052 cm 3 /g to 0.0162 cm 3 /g,
which was 210% of that at 20 °C; but when the temperature increased to 400 °C, the pore
volume of oil shale rapidly increased to 0.0952 cm 3 /g, which was about 4.9 times of that
at 20 °C; From 400 °C to 600 °C, the pore volume continued to grow as the temperature
rise, the pore volume of oil shale reached its maximum value at 600 °C, but the growth
rate of pore volume at this stage was relatively slow.
Fig. 3. Lateral morphological changes of the samples after pyrolysis
Figure 4 also showed the variation of the weight loss rate of oil shale after pyrolysis
at different temperatures (20 °C to 600 °C). From 20 °C to 300 °C, the weight loss of
oil shale specimens gradually increased to 4.12%, but it sharply increased to 11.03%
M. Cao et al.
Table 1. Pressure parameters of permeability test
Depth/m
Axial pressure/MPa
Confining
pressure/MPa
Volumetric
stress/MPa
Pore pressure/MPa
200
5
4
13
1
400
10
8
26
1, 3, 5
600
15
12
39
1, 3, 5, 7, 9
permeability test device according to the settings of different volume stress and pore
pressure conditions in Table 1;
3. After the test is completed, the three large tested specimens and the remaining small
tested specimens are put into the pyrolysis reactor again, heated to 200 °C, and kept
at a constant temperature for 6 h. Repeat step 2 until all permeability and mercury
intrusion tests after pyrolysis with the temperature from 100 °C to 600 °C, are
completed.
3 Results and Discussion
The permeability of oil shale with the temperature
Figure 3 given the variation of the pore volume and weight loss of oil shale after
pyrolysis at different temperatures. As shown in Fig. 3, under normal temperature condition (20 °C), the oil shale structure is relatively dense with a pore volume of the only
0.0022 cm 3 /g; When the pyrolysis temperature increased from 100 °C to 300 °C, the
pore volume of the oil shale specimen increased from 0.0052 cm 3 /g to 0.0162 cm 3 /g,
which was 210% of that at 20 °C; but when the temperature increased to 400 °C, the pore
volume of oil shale rapidly increased to 0.0952 cm 3 /g, which was about 4.9 times of that
at 20 °C; From 400 °C to 600 °C, the pore volume continued to grow as the temperature
rise, the pore volume of oil shale reached its maximum value at 600 °C, but the growth
rate of pore volume at this stage was relatively slow.
Fig. 3. Lateral morphological changes of the samples after pyrolysis
Figure 4 also showed the variation of the weight loss rate of oil shale after pyrolysis
at different temperatures (20 °C to 600 °C). From 20 °C to 300 °C, the weight loss of
oil shale specimens gradually increased to 4.12%, but it sharply increased to 11.03%