

168
H. Deng et al.
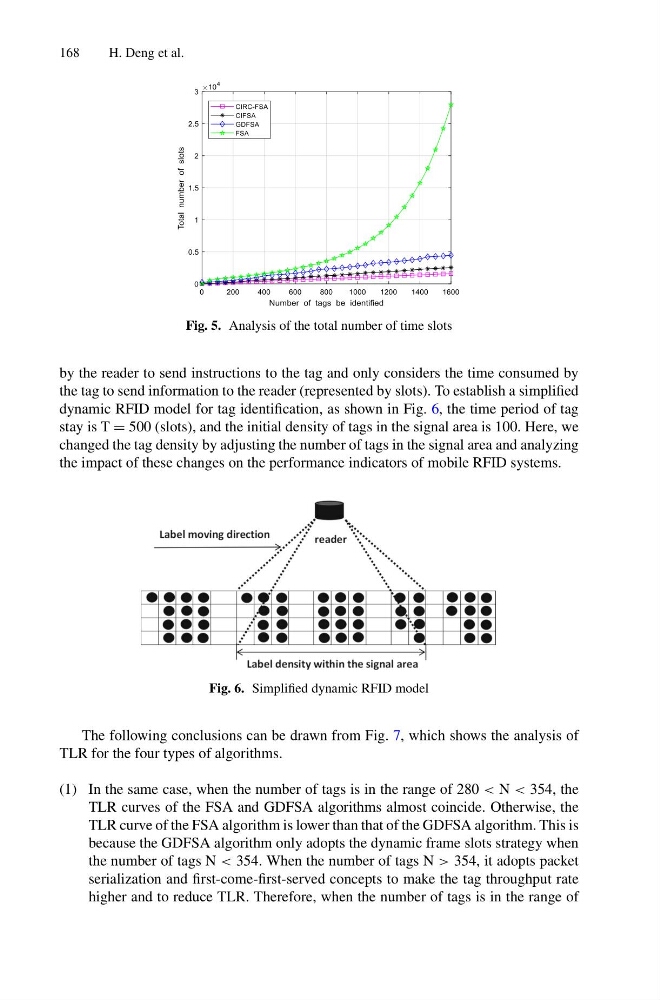
Fig. 5. Analysis of the total number of time slots
by the reader to send instructions to the tag and only considers the time consumed by
the tag to send information to the reader (represented by slots). To establish a simplified
dynamic RFID model for tag identification, as shown in Fig. 6, the time period of tag
stay is T = 500 (slots), and the initial density of tags in the signal area is 100. Here, we
changed the tag density by adjusting the number of tags in the signal area and analyzing
the impact of these changes on the performance indicators of mobile RFID systems.
Fig. 6. Simplified dynamic RFID model
The following conclusions can be drawn from Fig. 7, which shows the analysis of
TLR for the four types of algorithms.
(1) In the same case, when the number of tags is in the range of 280 < N < 354, the
TLR curves of the FSA and GDFSA algorithms almost coincide. Otherwise, the
TLR curve of the FSA algorithm is lower than that of the GDFSA algorithm. This is
because the GDFSA algorithm only adopts the dynamic frame slots strategy when
the number of tags N < 354. When the number of tags N > 354, it adopts packet
serialization and first-come-first-served concepts to make the tag throughput rate
higher and to reduce TLR. Therefore, when the number of tags is in the range of
H. Deng et al.
Fig. 5. Analysis of the total number of time slots
by the reader to send instructions to the tag and only considers the time consumed by
the tag to send information to the reader (represented by slots). To establish a simplified
dynamic RFID model for tag identification, as shown in Fig. 6, the time period of tag
stay is T = 500 (slots), and the initial density of tags in the signal area is 100. Here, we
changed the tag density by adjusting the number of tags in the signal area and analyzing
the impact of these changes on the performance indicators of mobile RFID systems.
Fig. 6. Simplified dynamic RFID model
The following conclusions can be drawn from Fig. 7, which shows the analysis of
TLR for the four types of algorithms.
(1) In the same case, when the number of tags is in the range of 280 < N < 354, the
TLR curves of the FSA and GDFSA algorithms almost coincide. Otherwise, the
TLR curve of the FSA algorithm is lower than that of the GDFSA algorithm. This is
because the GDFSA algorithm only adopts the dynamic frame slots strategy when
the number of tags N < 354. When the number of tags N > 354, it adopts packet
serialization and first-come-first-served concepts to make the tag throughput rate
higher and to reduce TLR. Therefore, when the number of tags is in the range of