

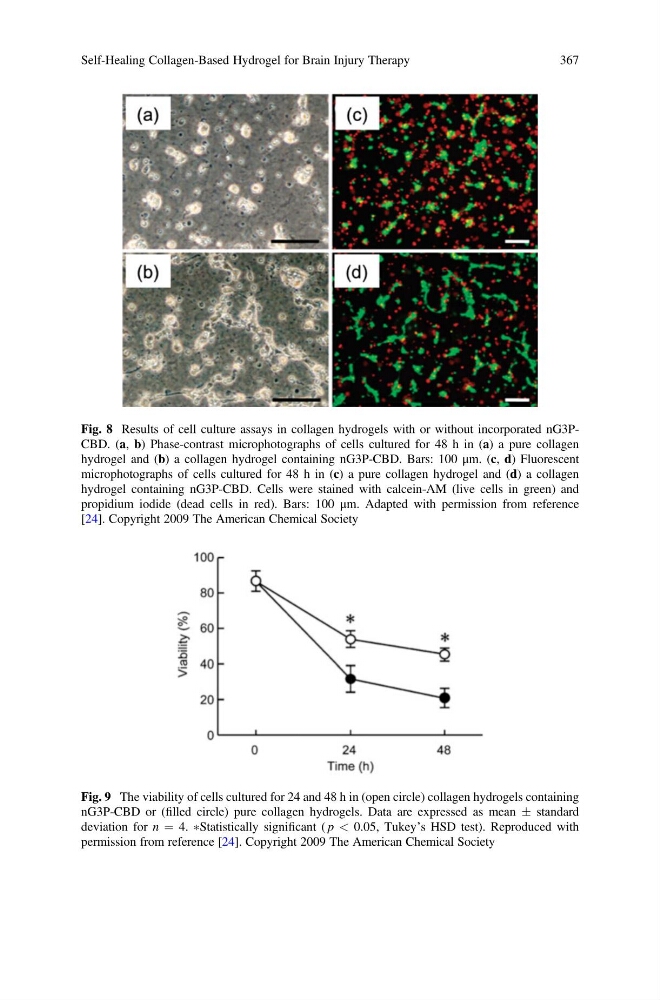
Fig. 8 Results of cell culture assays in collagen hydrogels with or without incorporated nG3PCBD. (a, b) Phase-contrast microphotographs of cells cultured for 48 h in (a) a pure collagen
hydrogel and (b) a collagen hydrogel containing nG3P-CBD. Bars: 100 μm. (c, d) Fluorescent
microphotographs of cells cultured for 48 h in (c) a pure collagen hydrogel and (d) a collagen
hydrogel containing nG3P-CBD. Cells were stained with calcein-AM (live cells in green) and
propidium iodide (dead cells in red). Bars: 100 μm. Adapted with permission from reference
[24]. Copyright 2009 The American Chemical Society
Fig. 9 The viability of cells cultured for 24 and 48 h in (open circle) collagen hydrogels containing
nG3P-CBD or (filled circle) pure collagen hydrogels. Data are expressed as mean Æ standard
deviation for n ¼ 4. ÃStatistically significant ( p < 0.05, Tukey’s HSD test). Reproduced with
permission from reference [24]. Copyright 2009 The American Chemical Society
Self-Healing Collagen-Based Hydrogel for Brain Injury Therapy
367
hydrogel and (b) a collagen hydrogel containing nG3P-CBD. Bars: 100 μm. (c, d) Fluorescent
microphotographs of cells cultured for 48 h in (c) a pure collagen hydrogel and (d) a collagen
hydrogel containing nG3P-CBD. Cells were stained with calcein-AM (live cells in green) and
propidium iodide (dead cells in red). Bars: 100 μm. Adapted with permission from reference
[24]. Copyright 2009 The American Chemical Society
Fig. 9 The viability of cells cultured for 24 and 48 h in (open circle) collagen hydrogels containing
nG3P-CBD or (filled circle) pure collagen hydrogels. Data are expressed as mean Æ standard
deviation for n ¼ 4. ÃStatistically significant ( p < 0.05, Tukey’s HSD test). Reproduced with
permission from reference [24]. Copyright 2009 The American Chemical Society
Self-Healing Collagen-Based Hydrogel for Brain Injury Therapy
367