

nutrient supply. For the observed difference in viability, the authors assumed that this
was due to antiapoptotic signaling cascades activated in the cells in consequence of an
interaction between G3P and α3β1 integrin. Indeed, integrin subunits α3 and β1 are
both expressed on the neurosphere-forming cells, being in good agreement with
previous reports for neural stem cells [29], cerebral cortex neurons [30], and differentiating neuroblastoma cells [31].
In 2010 Yao and co-workers reported the ability of collagen I-based hydrogel to
support neurite outgrowth in rat pheochromocytoma cells (PC12) [32]. Collagen
scaffolds were prepared using different concentrations of a fluorescent labeledlaminin peptide (PPFLMLLKGSTR). Although the results of this study indicated
that there is not a significant difference in neurite length on the LN-containing
collagen hydrogel when compared with a native collagen scaffold, neurites showed
a preferential growth orientation toward the high level of the LN peptide gradient on
the collagen hydrogel (Fig. 10). This observation suggests the existence of different
mechanisms involved in the regulation of neurite extension and neurite orientation.
In 2011, Lee and co-workers investigated the abilities of LN- and fibronectin
(FN)-modified collagen to stimulate neuro-induction of rat BMSCs (bone marrowderived mesenchymal stem cells) [33]. The effects of the 3D gel conditions on the
differentiation of MSCs into nerve cells were evaluated through observation of the
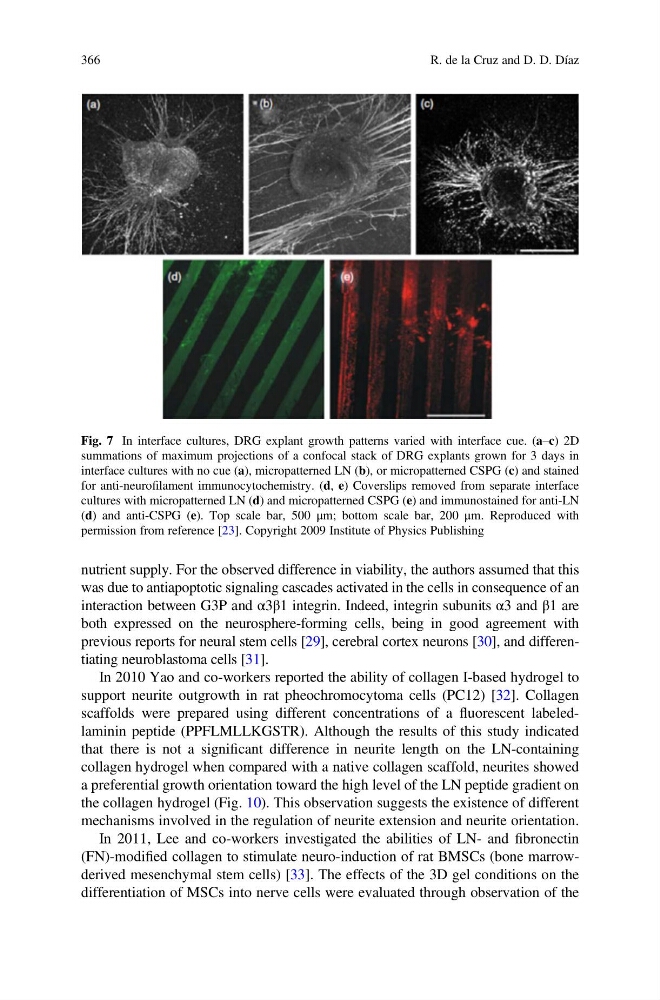
Fig. 7 In interface cultures, DRG explant growth patterns varied with interface cue. (a–c) 2D
summations of maximum projections of a confocal stack of DRG explants grown for 3 days in
interface cultures with no cue (a), micropatterned LN (b), or micropatterned CSPG (c) and stained
for anti-neurofilament immunocytochemistry. (d, e) Coverslips removed from separate interface
cultures with micropatterned LN (d) and micropatterned CSPG (e) and immunostained for anti-LN
(d) and anti-CSPG (e). Top scale bar, 500 μm; bottom scale bar, 200 μm. Reproduced with
permission from reference [23]. Copyright 2009 Institute of Physics Publishing
366
R. de la Cruz and D. D. Díaz
was due to antiapoptotic signaling cascades activated in the cells in consequence of an
interaction between G3P and α3β1 integrin. Indeed, integrin subunits α3 and β1 are
both expressed on the neurosphere-forming cells, being in good agreement with
previous reports for neural stem cells [29], cerebral cortex neurons [30], and differentiating neuroblastoma cells [31].
In 2010 Yao and co-workers reported the ability of collagen I-based hydrogel to
support neurite outgrowth in rat pheochromocytoma cells (PC12) [32]. Collagen
scaffolds were prepared using different concentrations of a fluorescent labeledlaminin peptide (PPFLMLLKGSTR). Although the results of this study indicated
that there is not a significant difference in neurite length on the LN-containing
collagen hydrogel when compared with a native collagen scaffold, neurites showed
a preferential growth orientation toward the high level of the LN peptide gradient on
the collagen hydrogel (Fig. 10). This observation suggests the existence of different
mechanisms involved in the regulation of neurite extension and neurite orientation.
In 2011, Lee and co-workers investigated the abilities of LN- and fibronectin
(FN)-modified collagen to stimulate neuro-induction of rat BMSCs (bone marrowderived mesenchymal stem cells) [33]. The effects of the 3D gel conditions on the
differentiation of MSCs into nerve cells were evaluated through observation of the
Fig. 7 In interface cultures, DRG explant growth patterns varied with interface cue. (a–c) 2D
summations of maximum projections of a confocal stack of DRG explants grown for 3 days in
interface cultures with no cue (a), micropatterned LN (b), or micropatterned CSPG (c) and stained
for anti-neurofilament immunocytochemistry. (d, e) Coverslips removed from separate interface
cultures with micropatterned LN (d) and micropatterned CSPG (e) and immunostained for anti-LN
(d) and anti-CSPG (e). Top scale bar, 500 μm; bottom scale bar, 200 μm. Reproduced with
permission from reference [23]. Copyright 2009 Institute of Physics Publishing
366
R. de la Cruz and D. D. Díaz