

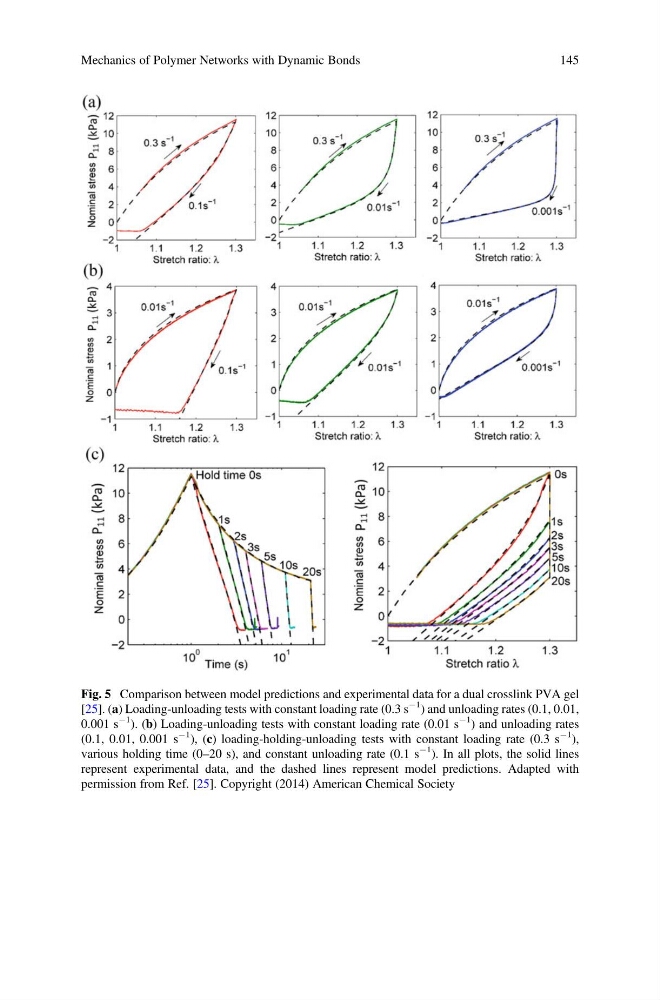
Fig. 5 Comparison between model predictions and experimental data for a dual crosslink PVA gel
[25]. (a) Loading-unloading tests with constant loading rate (0.3 s
À1
) and unloading rates (0.1, 0.01,
0.001 s
À1
). (b) Loading-unloading tests with constant loading rate (0.01 s
À1
) and unloading rates
(0.1, 0.01, 0.001 s
À1
), (c) loading-holding-unloading tests with constant loading rate (0.3 s
À1
),
various holding time (0–20 s), and constant unloading rate (0.1 s
À1
). In all plots, the solid lines
represent experimental data, and the dashed lines represent model predictions. Adapted with
permission from Ref. [25]. Copyright (2014) American Chemical Society
Mechanics of Polymer Networks with Dynamic Bonds
145
[25]. (a) Loading-unloading tests with constant loading rate (0.3 s
À1
) and unloading rates (0.1, 0.01,
0.001 s
À1
). (b) Loading-unloading tests with constant loading rate (0.01 s
À1
) and unloading rates
(0.1, 0.01, 0.001 s
À1
), (c) loading-holding-unloading tests with constant loading rate (0.3 s
À1
),
various holding time (0–20 s), and constant unloading rate (0.1 s
À1
). In all plots, the solid lines
represent experimental data, and the dashed lines represent model predictions. Adapted with
permission from Ref. [25]. Copyright (2014) American Chemical Society
Mechanics of Polymer Networks with Dynamic Bonds
145