

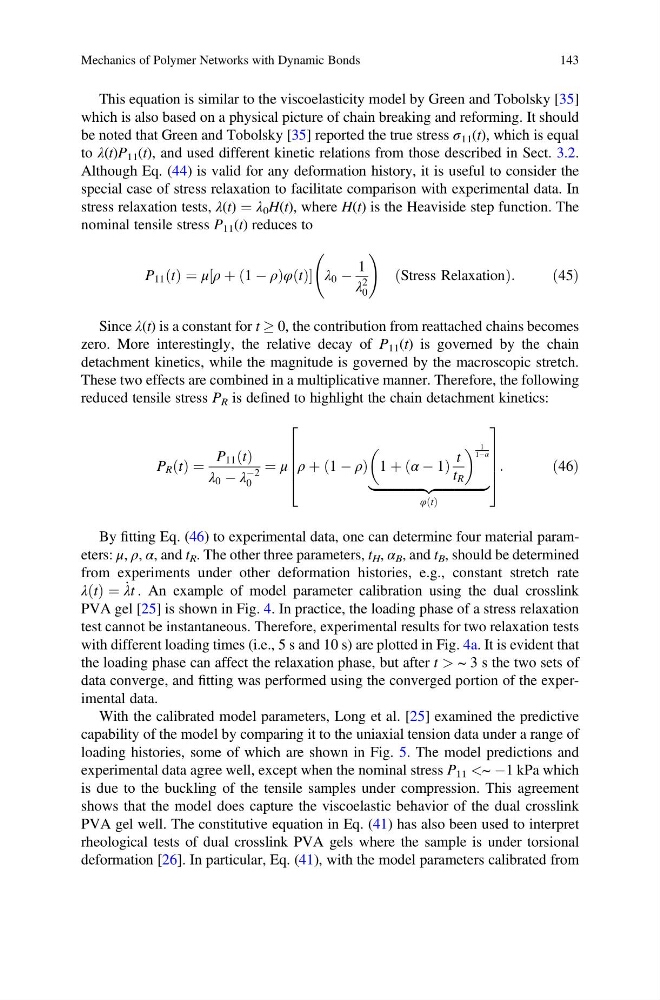
This equation is similar to the viscoelasticity model by Green and Tobolsky [35]
which is also based on a physical picture of chain breaking and reforming. It should
be noted that Green and Tobolsky [35] reported the true stress σ 11 (t), which is equal
to λ(t)P 11 (t), and used different kinetic relations from those described in Sect. 3.2.
Although Eq. (44) is valid for any deformation history, it is useful to consider the
special case of stress relaxation to facilitate comparison with experimental data. In
stress relaxation tests, λ(t) ¼ λ 0 H(t), where H(t) is the Heaviside step function. The
nominal tensile stress P 11 (t) reduces to
P 11 t
ð Þ ¼ μ ρ þ 1 À ρ
ð
Þφ t
ð Þ
½
λ 0 À
1
λ
2
0
!
Stress Relaxation
ð
Þ :
ð45Þ
Since λ(t) is a constant for t ! 0, the contribution from reattached chains becomes
zero. More interestingly, the relative decay of P 11 (t) is governed by the chain
detachment kinetics, while the magnitude is governed by the macroscopic stretch.
These two effects are combined in a multiplicative manner. Therefore, the following
reduced tensile stress P R is defined to highlight the chain detachment kinetics:
P R t
ð Þ ¼
P 11 t
ð Þ
λ 0 À λ
À2
0
¼ μ ρ þ 1 À ρ
ð
Þ 1 þ α À 1
ð
Þ
t
t R
1
1Àα
|fflfflfflfflfflfflfflfflfflfflfflfflfflfflffl ffl{zfflfflfflfflfflfflfflfflfflfflfflfflfflfflffl ffl}
φ t
ð Þ
2
6
6
6
4
3
7
7
7
5
:
ð46Þ
By fitting Eq. (46) to experimental data, one can determine four material parameters: μ, ρ, α, and t R . The other three parameters, t H , α B , and t B , should be determined
from experiments under other deformation histories, e.g., constant stretch rate
λ t
ð Þ ¼ _
λt . An example of model parameter calibration using the dual crosslink
PVA gel [25] is shown in Fig. 4. In practice, the loading phase of a stress relaxation
test cannot be instantaneous. Therefore, experimental results for two relaxation tests
with different loading times (i.e., 5 s and 10 s) are plotted in Fig. 4a. It is evident that
the loading phase can affect the relaxation phase, but after t > ~ 3 s the two sets of
data converge, and fitting was performed using the converged portion of the experimental data.
With the calibrated model parameters, Long et al. [25] examined the predictive
capability of the model by comparing it to the uniaxial tension data under a range of
loading histories, some of which are shown in Fig. 5. The model predictions and
experimental data agree well, except when the nominal stress P 11 <~ À1 kPa which
is due to the buckling of the tensile samples under compression. This agreement
shows that the model does capture the viscoelastic behavior of the dual crosslink
PVA gel well. The constitutive equation in Eq. (41) has also been used to interpret
rheological tests of dual crosslink PVA gels where the sample is under torsional
deformation [26]. In particular, Eq. (41), with the model parameters calibrated from
Mechanics of Polymer Networks with Dynamic Bonds
143
which is also based on a physical picture of chain breaking and reforming. It should
be noted that Green and Tobolsky [35] reported the true stress σ 11 (t), which is equal
to λ(t)P 11 (t), and used different kinetic relations from those described in Sect. 3.2.
Although Eq. (44) is valid for any deformation history, it is useful to consider the
special case of stress relaxation to facilitate comparison with experimental data. In
stress relaxation tests, λ(t) ¼ λ 0 H(t), where H(t) is the Heaviside step function. The
nominal tensile stress P 11 (t) reduces to
P 11 t
ð Þ ¼ μ ρ þ 1 À ρ
ð
Þφ t
ð Þ
½
λ 0 À
1
λ
2
0
!
Stress Relaxation
ð
Þ :
ð45Þ
Since λ(t) is a constant for t ! 0, the contribution from reattached chains becomes
zero. More interestingly, the relative decay of P 11 (t) is governed by the chain
detachment kinetics, while the magnitude is governed by the macroscopic stretch.
These two effects are combined in a multiplicative manner. Therefore, the following
reduced tensile stress P R is defined to highlight the chain detachment kinetics:
P R t
ð Þ ¼
P 11 t
ð Þ
λ 0 À λ
À2
0
¼ μ ρ þ 1 À ρ
ð
Þ 1 þ α À 1
ð
Þ
t
t R
1
1Àα
|fflfflfflfflfflfflfflfflfflfflfflfflfflfflffl ffl{zfflfflfflfflfflfflfflfflfflfflfflfflfflfflffl ffl}
φ t
ð Þ
2
6
6
6
4
3
7
7
7
5
:
ð46Þ
By fitting Eq. (46) to experimental data, one can determine four material parameters: μ, ρ, α, and t R . The other three parameters, t H , α B , and t B , should be determined
from experiments under other deformation histories, e.g., constant stretch rate
λ t
ð Þ ¼ _
λt . An example of model parameter calibration using the dual crosslink
PVA gel [25] is shown in Fig. 4. In practice, the loading phase of a stress relaxation
test cannot be instantaneous. Therefore, experimental results for two relaxation tests
with different loading times (i.e., 5 s and 10 s) are plotted in Fig. 4a. It is evident that
the loading phase can affect the relaxation phase, but after t > ~ 3 s the two sets of
data converge, and fitting was performed using the converged portion of the experimental data.
With the calibrated model parameters, Long et al. [25] examined the predictive
capability of the model by comparing it to the uniaxial tension data under a range of
loading histories, some of which are shown in Fig. 5. The model predictions and
experimental data agree well, except when the nominal stress P 11 <~ À1 kPa which
is due to the buckling of the tensile samples under compression. This agreement
shows that the model does capture the viscoelastic behavior of the dual crosslink
PVA gel well. The constitutive equation in Eq. (41) has also been used to interpret
rheological tests of dual crosslink PVA gels where the sample is under torsional
deformation [26]. In particular, Eq. (41), with the model parameters calibrated from
Mechanics of Polymer Networks with Dynamic Bonds
143