

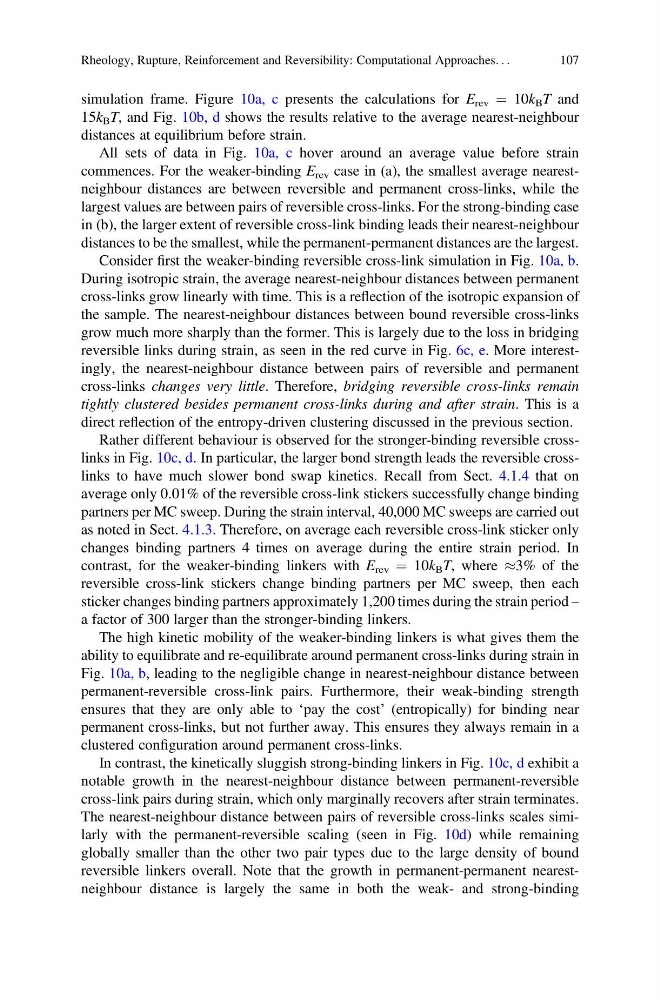
simulation frame. Figure 10a, c presents the calculations for E rev ¼ 10k B T and
15k B T, and Fig. 10b, d shows the results relative to the average nearest-neighbour
distances at equilibrium before strain.
All sets of data in Fig. 10a, c hover around an average value before strain
commences. For the weaker-binding E rev case in (a), the smallest average nearestneighbour distances are between reversible and permanent cross-links, while the
largest values are between pairs of reversible cross-links. For the strong-binding case
in (b), the larger extent of reversible cross-link binding leads their nearest-neighbour
distances to be the smallest, while the permanent-permanent distances are the largest.
Consider first the weaker-binding reversible cross-link simulation in Fig. 10a, b.
During isotropic strain, the average nearest-neighbour distances between permanent
cross-links grow linearly with time. This is a reflection of the isotropic expansion of
the sample. The nearest-neighbour distances between bound reversible cross-links
grow much more sharply than the former. This is largely due to the loss in bridging
reversible links during strain, as seen in the red curve in Fig. 6c, e. More interestingly, the nearest-neighbour distance between pairs of reversible and permanent
cross-links changes very little. Therefore, bridging reversible cross-links remain
tightly clustered besides permanent cross-links during and after strain. This is a
direct reflection of the entropy-driven clustering discussed in the previous section.
Rather different behaviour is observed for the stronger-binding reversible crosslinks in Fig. 10c, d. In particular, the larger bond strength leads the reversible crosslinks to have much slower bond swap kinetics. Recall from Sect. 4.1.4 that on
average only 0.01% of the reversible cross-link stickers successfully change binding
partners per MC sweep. During the strain interval, 40,000 MC sweeps are carried out
as noted in Sect. 4.1.3. Therefore, on average each reversible cross-link sticker only
changes binding partners 4 times on average during the entire strain period. In
contrast, for the weaker-binding linkers with E rev ¼ 10k B T, where %3% of the
reversible cross-link stickers change binding partners per MC sweep, then each
sticker changes binding partners approximately 1,200 times during the strain period –
a factor of 300 larger than the stronger-binding linkers.
The high kinetic mobility of the weaker-binding linkers is what gives them the
ability to equilibrate and re-equilibrate around permanent cross-links during strain in
Fig. 10a, b, leading to the negligible change in nearest-neighbour distance between
permanent-reversible cross-link pairs. Furthermore, their weak-binding strength
ensures that they are only able to ‘pay the cost’ (entropically) for binding near
permanent cross-links, but not further away. This ensures they always remain in a
clustered configuration around permanent cross-links.
In contrast, the kinetically sluggish strong-binding linkers in Fig. 10c, d exhibit a
notable growth in the nearest-neighbour distance between permanent-reversible
cross-link pairs during strain, which only marginally recovers after strain terminates.
The nearest-neighbour distance between pairs of reversible cross-links scales similarly with the permanent-reversible scaling (seen in Fig. 10d) while remaining
globally smaller than the other two pair types due to the large density of bound
reversible linkers overall. Note that the growth in permanent-permanent nearestneighbour distance is largely the same in both the weak- and strong-binding
Rheology, Rupture, Reinforcement and Reversibility: Computational Approaches. . .
107
15k B T, and Fig. 10b, d shows the results relative to the average nearest-neighbour
distances at equilibrium before strain.
All sets of data in Fig. 10a, c hover around an average value before strain
commences. For the weaker-binding E rev case in (a), the smallest average nearestneighbour distances are between reversible and permanent cross-links, while the
largest values are between pairs of reversible cross-links. For the strong-binding case
in (b), the larger extent of reversible cross-link binding leads their nearest-neighbour
distances to be the smallest, while the permanent-permanent distances are the largest.
Consider first the weaker-binding reversible cross-link simulation in Fig. 10a, b.
During isotropic strain, the average nearest-neighbour distances between permanent
cross-links grow linearly with time. This is a reflection of the isotropic expansion of
the sample. The nearest-neighbour distances between bound reversible cross-links
grow much more sharply than the former. This is largely due to the loss in bridging
reversible links during strain, as seen in the red curve in Fig. 6c, e. More interestingly, the nearest-neighbour distance between pairs of reversible and permanent
cross-links changes very little. Therefore, bridging reversible cross-links remain
tightly clustered besides permanent cross-links during and after strain. This is a
direct reflection of the entropy-driven clustering discussed in the previous section.
Rather different behaviour is observed for the stronger-binding reversible crosslinks in Fig. 10c, d. In particular, the larger bond strength leads the reversible crosslinks to have much slower bond swap kinetics. Recall from Sect. 4.1.4 that on
average only 0.01% of the reversible cross-link stickers successfully change binding
partners per MC sweep. During the strain interval, 40,000 MC sweeps are carried out
as noted in Sect. 4.1.3. Therefore, on average each reversible cross-link sticker only
changes binding partners 4 times on average during the entire strain period. In
contrast, for the weaker-binding linkers with E rev ¼ 10k B T, where %3% of the
reversible cross-link stickers change binding partners per MC sweep, then each
sticker changes binding partners approximately 1,200 times during the strain period –
a factor of 300 larger than the stronger-binding linkers.
The high kinetic mobility of the weaker-binding linkers is what gives them the
ability to equilibrate and re-equilibrate around permanent cross-links during strain in
Fig. 10a, b, leading to the negligible change in nearest-neighbour distance between
permanent-reversible cross-link pairs. Furthermore, their weak-binding strength
ensures that they are only able to ‘pay the cost’ (entropically) for binding near
permanent cross-links, but not further away. This ensures they always remain in a
clustered configuration around permanent cross-links.
In contrast, the kinetically sluggish strong-binding linkers in Fig. 10c, d exhibit a
notable growth in the nearest-neighbour distance between permanent-reversible
cross-link pairs during strain, which only marginally recovers after strain terminates.
The nearest-neighbour distance between pairs of reversible cross-links scales similarly with the permanent-reversible scaling (seen in Fig. 10d) while remaining
globally smaller than the other two pair types due to the large density of bound
reversible linkers overall. Note that the growth in permanent-permanent nearestneighbour distance is largely the same in both the weak- and strong-binding
Rheology, Rupture, Reinforcement and Reversibility: Computational Approaches. . .
107