

order of tens of k B T – with contour distance from the existing cross-link. This
entropic bias, due to the entropy of the polymer strands themselves, leads to the
strongly peaked distribution of reversible binding around permanent cross-links in
the simulation.
4.1.8 Spatial Reordering and Kinetics of Clustered Reversible
Cross-Links During Strain
As the polymer gel in the simulation is strained isotropically, the length scale
between permanent cross-links and bound reversible cross-links grows larger. In
an ideal Gaussian network, these distances grow affinely [89], while in a real
network such as here in the simulation, this is not necessarily the case.
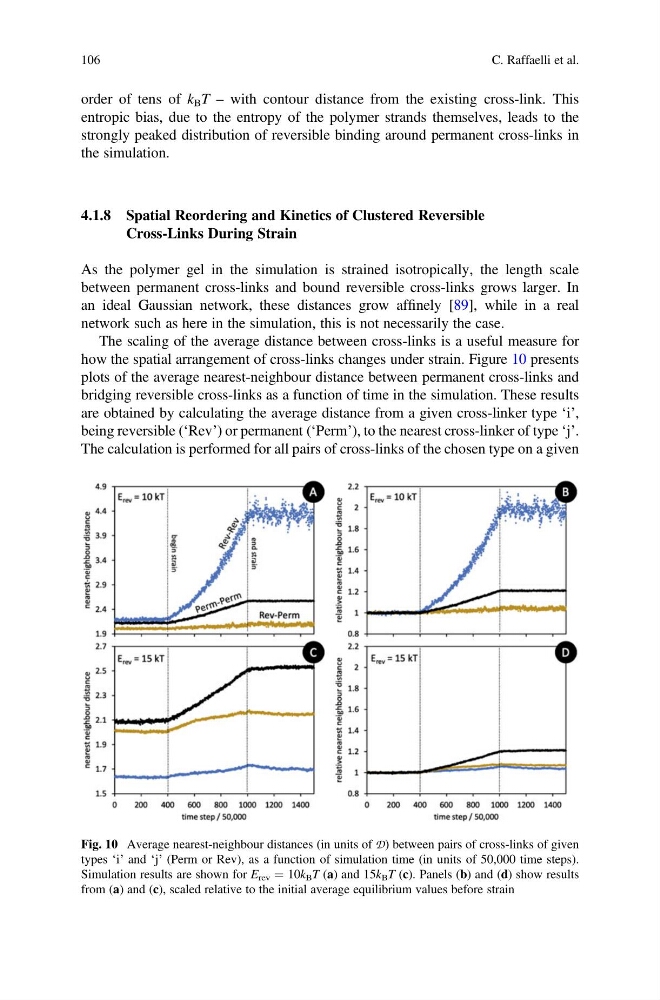
The scaling of the average distance between cross-links is a useful measure for
how the spatial arrangement of cross-links changes under strain. Figure 10 presents
plots of the average nearest-neighbour distance between permanent cross-links and
bridging reversible cross-links as a function of time in the simulation. These results
are obtained by calculating the average distance from a given cross-linker type ‘i’,
being reversible (‘Rev’) or permanent (‘Perm’), to the nearest cross-linker of type ‘j’.
The calculation is performed for all pairs of cross-links of the chosen type on a given
Fig. 10 Average nearest-neighbour distances (in units of D) between pairs of cross-links of given
types ‘i’ and ‘j’ (Perm or Rev), as a function of simulation time (in units of 50,000 time steps).
Simulation results are shown for E rev ¼ 10k B T (a) and 15k B T (c). Panels (b) and (d) show results
from (a) and (c), scaled relative to the initial average equilibrium values before strain
106
C. Raffaelli et al.
entropic bias, due to the entropy of the polymer strands themselves, leads to the
strongly peaked distribution of reversible binding around permanent cross-links in
the simulation.
4.1.8 Spatial Reordering and Kinetics of Clustered Reversible
Cross-Links During Strain
As the polymer gel in the simulation is strained isotropically, the length scale
between permanent cross-links and bound reversible cross-links grows larger. In
an ideal Gaussian network, these distances grow affinely [89], while in a real
network such as here in the simulation, this is not necessarily the case.
The scaling of the average distance between cross-links is a useful measure for
how the spatial arrangement of cross-links changes under strain. Figure 10 presents
plots of the average nearest-neighbour distance between permanent cross-links and
bridging reversible cross-links as a function of time in the simulation. These results
are obtained by calculating the average distance from a given cross-linker type ‘i’,
being reversible (‘Rev’) or permanent (‘Perm’), to the nearest cross-linker of type ‘j’.
The calculation is performed for all pairs of cross-links of the chosen type on a given
Fig. 10 Average nearest-neighbour distances (in units of D) between pairs of cross-links of given
types ‘i’ and ‘j’ (Perm or Rev), as a function of simulation time (in units of 50,000 time steps).
Simulation results are shown for E rev ¼ 10k B T (a) and 15k B T (c). Panels (b) and (d) show results
from (a) and (c), scaled relative to the initial average equilibrium values before strain
106
C. Raffaelli et al.