

304
R. J. Casperson
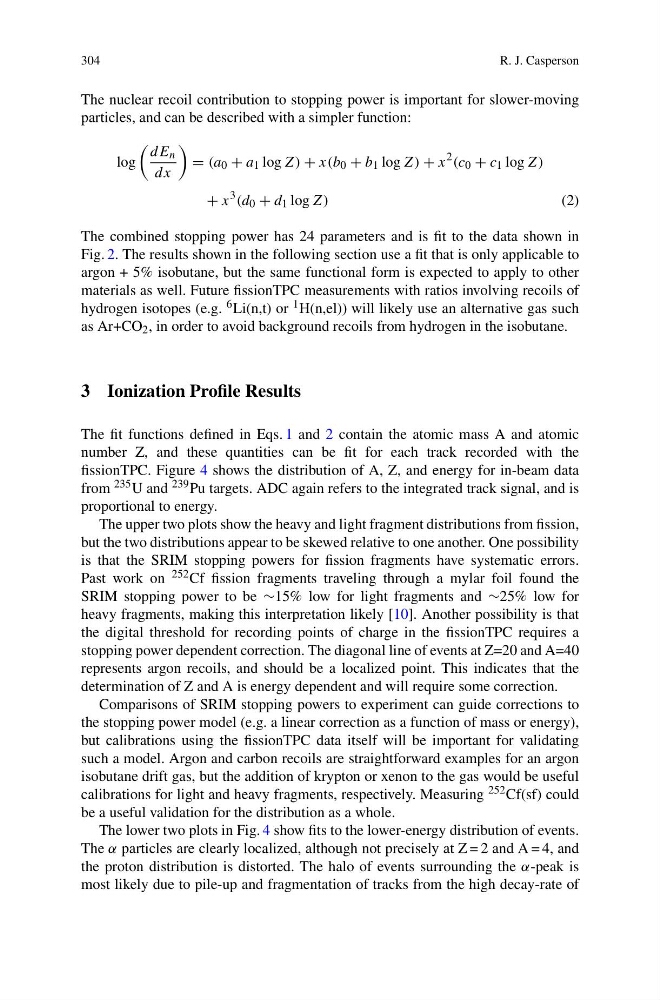
The nuclear recoil contribution to stopping power is important for slower-moving
particles, and can be described with a simpler function:
log
dE n
dx
= (a 0 + a 1 log Z) + x(b 0 + b 1 log Z) + x
2 (c 0 + c 1 log Z)
+ x
3 (d 0 + d 1 log Z)
(2)
The combined stopping power has 24 parameters and is fit to the data shown in
Fig. 2. The results shown in the following section use a fit that is only applicable to
argon + 5% isobutane, but the same functional form is expected to apply to other
materials as well. Future fissionTPC measurements with ratios involving recoils of
hydrogen isotopes (e.g. 6 Li(n,t) or 1 H(n,el)) will likely use an alternative gas such
as Ar+CO 2 , in order to avoid background recoils from hydrogen in the isobutane.
3 Ionization Profile Results
The fit functions defined in Eqs. 1 and 2 contain the atomic mass A and atomic
number Z, and these quantities can be fit for each track recorded with the
fissionTPC. Figure 4 shows the distribution of A, Z, and energy for in-beam data
from 235 U and 239 Pu targets. ADC again refers to the integrated track signal, and is
proportional to energy.
The upper two plots show the heavy and light fragment distributions from fission,
but the two distributions appear to be skewed relative to one another. One possibility
is that the SRIM stopping powers for fission fragments have systematic errors.
Past work on 252 Cf fission fragments traveling through a mylar foil found the
SRIM stopping power to be ∼15% low for light fragments and ∼25% low for
heavy fragments, making this interpretation likely [10]. Another possibility is that
the digital threshold for recording points of charge in the fissionTPC requires a
stopping power dependent correction. The diagonal line of events at Z=20 and A=40
represents argon recoils, and should be a localized point. This indicates that the
determination of Z and A is energy dependent and will require some correction.
Comparisons of SRIM stopping powers to experiment can guide corrections to
the stopping power model (e.g. a linear correction as a function of mass or energy),
but calibrations using the fissionTPC data itself will be important for validating
such a model. Argon and carbon recoils are straightforward examples for an argon
isobutane drift gas, but the addition of krypton or xenon to the gas would be useful
calibrations for light and heavy fragments, respectively. Measuring 252 Cf(sf) could
be a useful validation for the distribution as a whole.
The lower two plots in Fig. 4 show fits to the lower-energy distribution of events.
The α particles are clearly localized, although not precisely at Z = 2 and A = 4, and
the proton distribution is distorted. The halo of events surrounding the α-peak is
most likely due to pile-up and fragmentation of tracks from the high decay-rate of
R. J. Casperson
The nuclear recoil contribution to stopping power is important for slower-moving
particles, and can be described with a simpler function:
log
dE n
dx
= (a 0 + a 1 log Z) + x(b 0 + b 1 log Z) + x
2 (c 0 + c 1 log Z)
+ x
3 (d 0 + d 1 log Z)
(2)
The combined stopping power has 24 parameters and is fit to the data shown in
Fig. 2. The results shown in the following section use a fit that is only applicable to
argon + 5% isobutane, but the same functional form is expected to apply to other
materials as well. Future fissionTPC measurements with ratios involving recoils of
hydrogen isotopes (e.g. 6 Li(n,t) or 1 H(n,el)) will likely use an alternative gas such
as Ar+CO 2 , in order to avoid background recoils from hydrogen in the isobutane.
3 Ionization Profile Results
The fit functions defined in Eqs. 1 and 2 contain the atomic mass A and atomic
number Z, and these quantities can be fit for each track recorded with the
fissionTPC. Figure 4 shows the distribution of A, Z, and energy for in-beam data
from 235 U and 239 Pu targets. ADC again refers to the integrated track signal, and is
proportional to energy.
The upper two plots show the heavy and light fragment distributions from fission,
but the two distributions appear to be skewed relative to one another. One possibility
is that the SRIM stopping powers for fission fragments have systematic errors.
Past work on 252 Cf fission fragments traveling through a mylar foil found the
SRIM stopping power to be ∼15% low for light fragments and ∼25% low for
heavy fragments, making this interpretation likely [10]. Another possibility is that
the digital threshold for recording points of charge in the fissionTPC requires a
stopping power dependent correction. The diagonal line of events at Z=20 and A=40
represents argon recoils, and should be a localized point. This indicates that the
determination of Z and A is energy dependent and will require some correction.
Comparisons of SRIM stopping powers to experiment can guide corrections to
the stopping power model (e.g. a linear correction as a function of mass or energy),
but calibrations using the fissionTPC data itself will be important for validating
such a model. Argon and carbon recoils are straightforward examples for an argon
isobutane drift gas, but the addition of krypton or xenon to the gas would be useful
calibrations for light and heavy fragments, respectively. Measuring 252 Cf(sf) could
be a useful validation for the distribution as a whole.
The lower two plots in Fig. 4 show fits to the lower-energy distribution of events.
The α particles are clearly localized, although not precisely at Z = 2 and A = 4, and
the proton distribution is distorted. The halo of events surrounding the α-peak is
most likely due to pile-up and fragmentation of tracks from the high decay-rate of