

160
P. von Neumann-Cosel
2
4
6
8
10
12
Energy (MeV)
10 −1
10 0
10 1
10 2
10 3
10 4
10 5
10 6
10 7
Total Level Density (MeV −1
)
208 Pb(p,p’)
208 Pb( 3 He, 3 He’γ)
Discrete LD
BSFGM (RIPL-3)
BSFGM (Rauscher et al.)
BSFGM (Syed et al.)
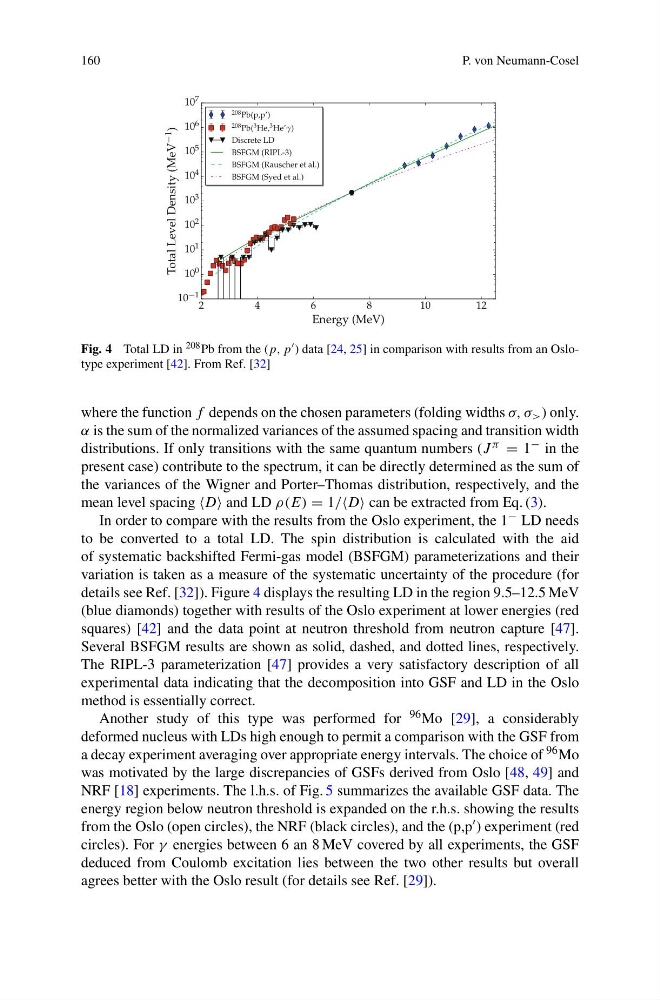
Fig. 4 Total LD in 208 Pb from the (p, p ) data [24, 25] in comparison with results from an Oslotype experiment [42]. From Ref. [32]
where the function f depends on the chosen parameters (folding widths σ, σ > ) only.
α is the sum of the normalized variances of the assumed spacing and transition width
distributions. If only transitions with the same quantum numbers (J π = 1 − in the
present case) contribute to the spectrum, it can be directly determined as the sum of
the variances of the Wigner and Porter–Thomas distribution, respectively, and the
mean level spacing D and LD ρ(E) = 1/D can be extracted from Eq. (3).
In order to compare with the results from the Oslo experiment, the 1 − LD needs
to be converted to a total LD. The spin distribution is calculated with the aid
of systematic backshifted Fermi-gas model (BSFGM) parameterizations and their
variation is taken as a measure of the systematic uncertainty of the procedure (for
details see Ref. [32]). Figure 4 displays the resulting LD in the region 9.5–12.5 MeV
(blue diamonds) together with results of the Oslo experiment at lower energies (red
squares) [42] and the data point at neutron threshold from neutron capture [47].
Several BSFGM results are shown as solid, dashed, and dotted lines, respectively.
The RIPL-3 parameterization [47] provides a very satisfactory description of all
experimental data indicating that the decomposition into GSF and LD in the Oslo
method is essentially correct.
Another study of this type was performed for 96 Mo [29], a considerably
deformed nucleus with LDs high enough to permit a comparison with the GSF from
a decay experiment averaging over appropriate energy intervals. The choice of 96 Mo
was motivated by the large discrepancies of GSFs derived from Oslo [48, 49] and
NRF [18] experiments. The l.h.s. of Fig. 5 summarizes the available GSF data. The
energy region below neutron threshold is expanded on the r.h.s. showing the results
from the Oslo (open circles), the NRF (black circles), and the (p,p ) experiment (red
circles). For γ energies between 6 an 8 MeV covered by all experiments, the GSF
deduced from Coulomb excitation lies between the two other results but overall
agrees better with the Oslo result (for details see Ref. [29]).
P. von Neumann-Cosel
2
4
6
8
10
12
Energy (MeV)
10 −1
10 0
10 1
10 2
10 3
10 4
10 5
10 6
10 7
Total Level Density (MeV −1
)
208 Pb(p,p’)
208 Pb( 3 He, 3 He’γ)
Discrete LD
BSFGM (RIPL-3)
BSFGM (Rauscher et al.)
BSFGM (Syed et al.)
Fig. 4 Total LD in 208 Pb from the (p, p ) data [24, 25] in comparison with results from an Oslotype experiment [42]. From Ref. [32]
where the function f depends on the chosen parameters (folding widths σ, σ > ) only.
α is the sum of the normalized variances of the assumed spacing and transition width
distributions. If only transitions with the same quantum numbers (J π = 1 − in the
present case) contribute to the spectrum, it can be directly determined as the sum of
the variances of the Wigner and Porter–Thomas distribution, respectively, and the
mean level spacing D and LD ρ(E) = 1/D can be extracted from Eq. (3).
In order to compare with the results from the Oslo experiment, the 1 − LD needs
to be converted to a total LD. The spin distribution is calculated with the aid
of systematic backshifted Fermi-gas model (BSFGM) parameterizations and their
variation is taken as a measure of the systematic uncertainty of the procedure (for
details see Ref. [32]). Figure 4 displays the resulting LD in the region 9.5–12.5 MeV
(blue diamonds) together with results of the Oslo experiment at lower energies (red
squares) [42] and the data point at neutron threshold from neutron capture [47].
Several BSFGM results are shown as solid, dashed, and dotted lines, respectively.
The RIPL-3 parameterization [47] provides a very satisfactory description of all
experimental data indicating that the decomposition into GSF and LD in the Oslo
method is essentially correct.
Another study of this type was performed for 96 Mo [29], a considerably
deformed nucleus with LDs high enough to permit a comparison with the GSF from
a decay experiment averaging over appropriate energy intervals. The choice of 96 Mo
was motivated by the large discrepancies of GSFs derived from Oslo [48, 49] and
NRF [18] experiments. The l.h.s. of Fig. 5 summarizes the available GSF data. The
energy region below neutron threshold is expanded on the r.h.s. showing the results
from the Oslo (open circles), the NRF (black circles), and the (p,p ) experiment (red
circles). For γ energies between 6 an 8 MeV covered by all experiments, the GSF
deduced from Coulomb excitation lies between the two other results but overall
agrees better with the Oslo result (for details see Ref. [29]).