

Gamma Strength Functions and the Brink-Axel Hypothesis
159
5
10
15
20
Energy (MeV)
10 −10
10 −9
10 −8
10 −7
10 −6
10 −5
Total GSF (MeV −3
)
208 Pb(p,p’)
208 Pb( 3 He, 3 He’γ)
Total GSF (SLO)
Total GSF (EGLO)
5.0 5.5 6.0 6.5 7.0 7.5 8.0
10 −8
10 −7
10 −6
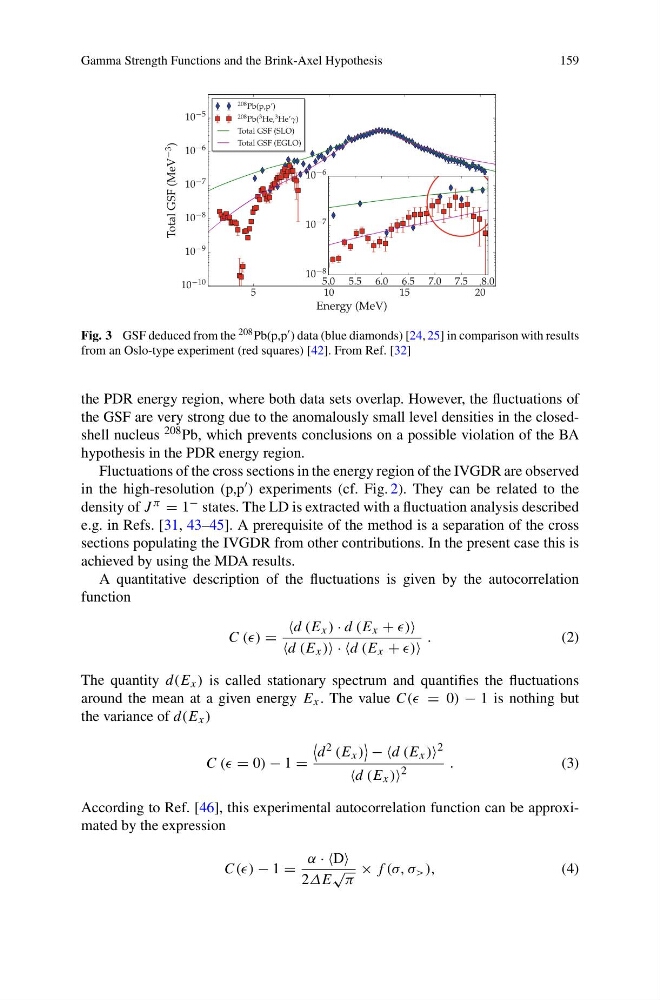
Fig. 3 GSF deduced from the 208 Pb(p,p ) data (blue diamonds) [24, 25] in comparison with results
from an Oslo-type experiment (red squares) [42]. From Ref. [32]
the PDR energy region, where both data sets overlap. However, the fluctuations of
the GSF are very strong due to the anomalously small level densities in the closedshell nucleus 208 Pb, which prevents conclusions on a possible violation of the BA
hypothesis in the PDR energy region.
Fluctuations of the cross sections in the energy region of the IVGDR are observed
in the high-resolution (p,p ) experiments (cf. Fig. 2). They can be related to the
density of J π = 1 − states. The LD is extracted with a fluctuation analysis described
e.g. in Refs. [31, 43–45]. A prerequisite of the method is a separation of the cross
sections populating the IVGDR from other contributions. In the present case this is
achieved by using the MDA results.
A quantitative description of the fluctuations is given by the autocorrelation
function
C () =
d (E x ) · d (E x + )
d (E x ) · d (E x + )
.
(2)
The quantity d(E x ) is called stationary spectrum and quantifies the fluctuations
around the mean at a given energy E x . The value C(( = 0) − 1 is nothing but
the variance of d(E x )
C ( = 0) − 1 =
d 2 (E x )
− d (E x )
2
d (E x )
2
.
(3)
According to Ref. [46], this experimental autocorrelation function can be approximated by the expression
C(() − 1 =
α · ·D
2ΔE
√
π
× f (σ, σ > ),
(4)
159
5
10
15
20
Energy (MeV)
10 −10
10 −9
10 −8
10 −7
10 −6
10 −5
Total GSF (MeV −3
)
208 Pb(p,p’)
208 Pb( 3 He, 3 He’γ)
Total GSF (SLO)
Total GSF (EGLO)
5.0 5.5 6.0 6.5 7.0 7.5 8.0
10 −8
10 −7
10 −6
Fig. 3 GSF deduced from the 208 Pb(p,p ) data (blue diamonds) [24, 25] in comparison with results
from an Oslo-type experiment (red squares) [42]. From Ref. [32]
the PDR energy region, where both data sets overlap. However, the fluctuations of
the GSF are very strong due to the anomalously small level densities in the closedshell nucleus 208 Pb, which prevents conclusions on a possible violation of the BA
hypothesis in the PDR energy region.
Fluctuations of the cross sections in the energy region of the IVGDR are observed
in the high-resolution (p,p ) experiments (cf. Fig. 2). They can be related to the
density of J π = 1 − states. The LD is extracted with a fluctuation analysis described
e.g. in Refs. [31, 43–45]. A prerequisite of the method is a separation of the cross
sections populating the IVGDR from other contributions. In the present case this is
achieved by using the MDA results.
A quantitative description of the fluctuations is given by the autocorrelation
function
C () =
d (E x ) · d (E x + )
d (E x ) · d (E x + )
.
(2)
The quantity d(E x ) is called stationary spectrum and quantifies the fluctuations
around the mean at a given energy E x . The value C(( = 0) − 1 is nothing but
the variance of d(E x )
C ( = 0) − 1 =
d 2 (E x )
− d (E x )
2
d (E x )
2
.
(3)
According to Ref. [46], this experimental autocorrelation function can be approximated by the expression
C(() − 1 =
α · ·D
2ΔE
√
π
× f (σ, σ > ),
(4)