

158
P. von Neumann-Cosel
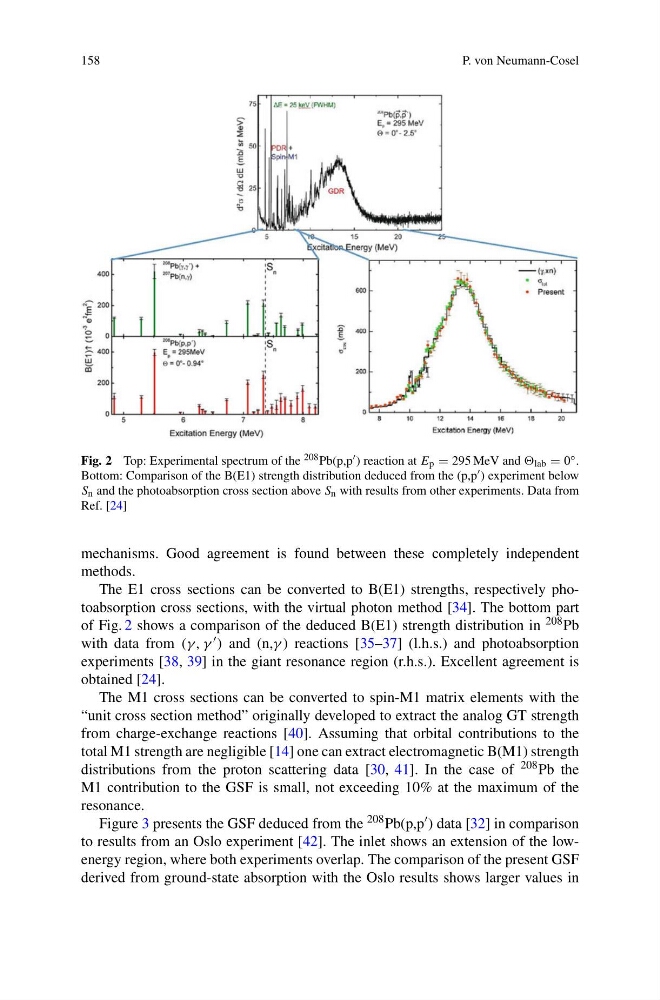
Fig. 2 Top: Experimental spectrum of the 208 Pb(p,p ) reaction at E p = 295 MeV and lab = 0 ◦ .
Bottom: Comparison of the B(E1) strength distribution deduced from the (p,p ) experiment below
S n and the photoabsorption cross section above S n with results from other experiments. Data from
Ref. [24]
mechanisms. Good agreement is found between these completely independent
methods.
The E1 cross sections can be converted to B(E1) strengths, respectively photoabsorption cross sections, with the virtual photon method [34]. The bottom part
of Fig. 2 shows a comparison of the deduced B(E1) strength distribution in 208 Pb
with data from (γ , γ ) and (n,γ ) reactions [35–37] (l.h.s.) and photoabsorption
experiments [38, 39] in the giant resonance region (r.h.s.). Excellent agreement is
obtained [24].
The M1 cross sections can be converted to spin-M1 matrix elements with the
“unit cross section method” originally developed to extract the analog GT strength
from charge-exchange reactions [40]. Assuming that orbital contributions to the
total M1 strength are negligible [14] one can extract electromagnetic B(M1) strength
distributions from the proton scattering data [30, 41]. In the case of 208 Pb the
M1 contribution to the GSF is small, not exceeding 10% at the maximum of the
resonance.
Figure 3 presents the GSF deduced from the 208 Pb(p,p ) data [32] in comparison
to results from an Oslo experiment [42]. The inlet shows an extension of the lowenergy region, where both experiments overlap. The comparison of the present GSF
derived from ground-state absorption with the Oslo results shows larger values in
P. von Neumann-Cosel
Fig. 2 Top: Experimental spectrum of the 208 Pb(p,p ) reaction at E p = 295 MeV and lab = 0 ◦ .
Bottom: Comparison of the B(E1) strength distribution deduced from the (p,p ) experiment below
S n and the photoabsorption cross section above S n with results from other experiments. Data from
Ref. [24]
mechanisms. Good agreement is found between these completely independent
methods.
The E1 cross sections can be converted to B(E1) strengths, respectively photoabsorption cross sections, with the virtual photon method [34]. The bottom part
of Fig. 2 shows a comparison of the deduced B(E1) strength distribution in 208 Pb
with data from (γ , γ ) and (n,γ ) reactions [35–37] (l.h.s.) and photoabsorption
experiments [38, 39] in the giant resonance region (r.h.s.). Excellent agreement is
obtained [24].
The M1 cross sections can be converted to spin-M1 matrix elements with the
“unit cross section method” originally developed to extract the analog GT strength
from charge-exchange reactions [40]. Assuming that orbital contributions to the
total M1 strength are negligible [14] one can extract electromagnetic B(M1) strength
distributions from the proton scattering data [30, 41]. In the case of 208 Pb the
M1 contribution to the GSF is small, not exceeding 10% at the maximum of the
resonance.
Figure 3 presents the GSF deduced from the 208 Pb(p,p ) data [32] in comparison
to results from an Oslo experiment [42]. The inlet shows an extension of the lowenergy region, where both experiments overlap. The comparison of the present GSF
derived from ground-state absorption with the Oslo results shows larger values in