

Gamma Strength Functions and the Brink-Axel Hypothesis
161
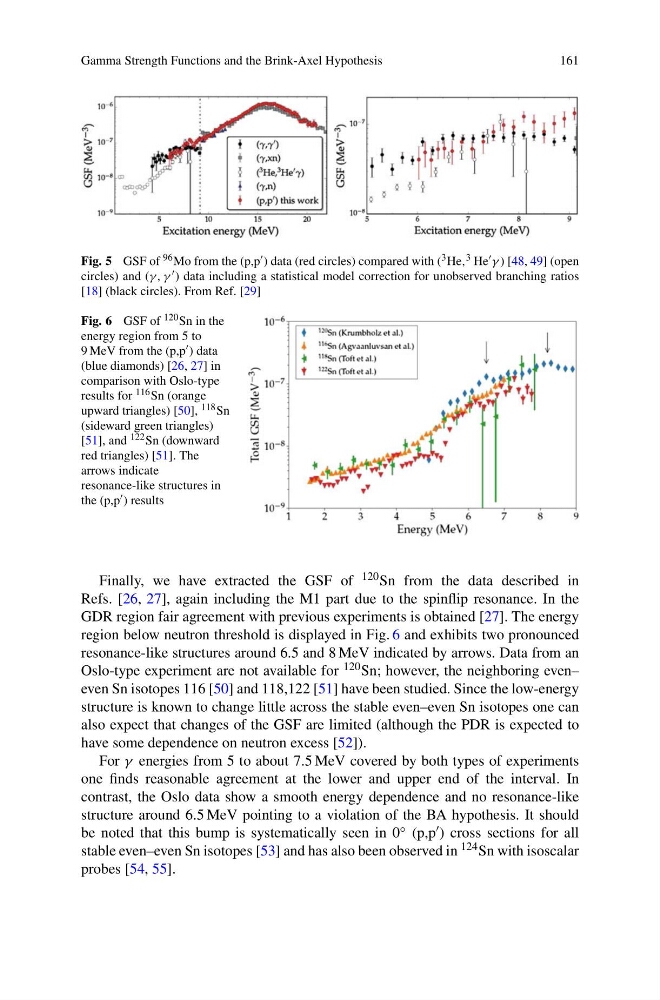
Fig. 5 GSF of 96 Mo from the (p,p ) data (red circles) compared with ( 3 He, 3 He
γ ) [48, 49] (open
circles) and (γ, γ ) data including a statistical model correction for unobserved branching ratios
[18] (black circles). From Ref. [29]
Fig. 6 GSF of 120 Sn in the
energy region from 5 to
9 MeV from the (p,p ) data
(blue diamonds) [26, 27] in
comparison with Oslo-type
results for 116 Sn (orange
upward triangles) [50], 118 Sn
(sideward green triangles)
[51], and 122 Sn (downward
red triangles) [51]. The
arrows indicate
resonance-like structures in
the (p,p ) results
Finally, we have extracted the GSF of 120 Sn from the data described in
Refs. [26, 27], again including the M1 part due to the spinflip resonance. In the
GDR region fair agreement with previous experiments is obtained [27]. The energy
region below neutron threshold is displayed in Fig. 6 and exhibits two pronounced
resonance-like structures around 6.5 and 8 MeV indicated by arrows. Data from an
Oslo-type experiment are not available for 120 Sn; however, the neighboring even–
even Sn isotopes 116 [50] and 118,122 [51] have been studied. Since the low-energy
structure is known to change little across the stable even–even Sn isotopes one can
also expect that changes of the GSF are limited (although the PDR is expected to
have some dependence on neutron excess [52]).
For γ energies from 5 to about 7.5 MeV covered by both types of experiments
one finds reasonable agreement at the lower and upper end of the interval. In
contrast, the Oslo data show a smooth energy dependence and no resonance-like
structure around 6.5 MeV pointing to a violation of the BA hypothesis. It should
be noted that this bump is systematically seen in 0 ◦ (p,p ) cross sections for all
stable even–even Sn isotopes [53] and has also been observed in 124 Sn with isoscalar
probes [54, 55].
161
Fig. 5 GSF of 96 Mo from the (p,p ) data (red circles) compared with ( 3 He, 3 He
γ ) [48, 49] (open
circles) and (γ, γ ) data including a statistical model correction for unobserved branching ratios
[18] (black circles). From Ref. [29]
Fig. 6 GSF of 120 Sn in the
energy region from 5 to
9 MeV from the (p,p ) data
(blue diamonds) [26, 27] in
comparison with Oslo-type
results for 116 Sn (orange
upward triangles) [50], 118 Sn
(sideward green triangles)
[51], and 122 Sn (downward
red triangles) [51]. The
arrows indicate
resonance-like structures in
the (p,p ) results
Finally, we have extracted the GSF of 120 Sn from the data described in
Refs. [26, 27], again including the M1 part due to the spinflip resonance. In the
GDR region fair agreement with previous experiments is obtained [27]. The energy
region below neutron threshold is displayed in Fig. 6 and exhibits two pronounced
resonance-like structures around 6.5 and 8 MeV indicated by arrows. Data from an
Oslo-type experiment are not available for 120 Sn; however, the neighboring even–
even Sn isotopes 116 [50] and 118,122 [51] have been studied. Since the low-energy
structure is known to change little across the stable even–even Sn isotopes one can
also expect that changes of the GSF are limited (although the PDR is expected to
have some dependence on neutron excess [52]).
For γ energies from 5 to about 7.5 MeV covered by both types of experiments
one finds reasonable agreement at the lower and upper end of the interval. In
contrast, the Oslo data show a smooth energy dependence and no resonance-like
structure around 6.5 MeV pointing to a violation of the BA hypothesis. It should
be noted that this bump is systematically seen in 0 ◦ (p,p ) cross sections for all
stable even–even Sn isotopes [53] and has also been observed in 124 Sn with isoscalar
probes [54, 55].