

148
M. A. A. Mamun et al.
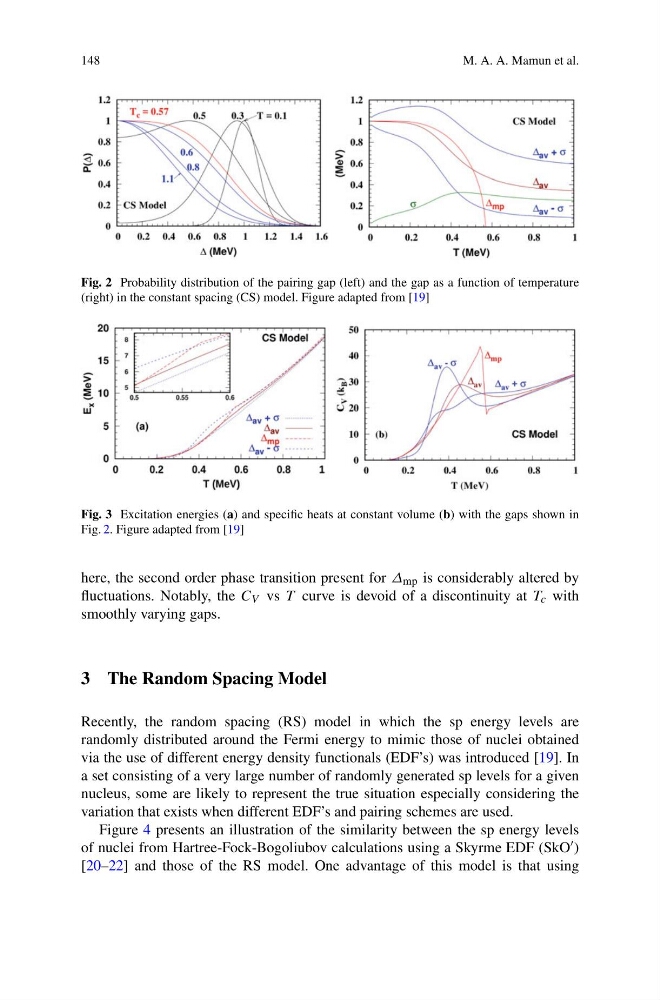
Fig. 2 Probability distribution of the pairing gap (left) and the gap as a function of temperature
(right) in the constant spacing (CS) model. Figure adapted from [19]
Fig. 3 Excitation energies (a) and specific heats at constant volume (b) with the gaps shown in
Fig. 2. Figure adapted from [19]
here, the second order phase transition present for Δ mp is considerably altered by
fluctuations. Notably, the C V vs T curve is devoid of a discontinuity at T c with
smoothly varying gaps.
3 The Random Spacing Model
Recently, the random spacing (RS) model in which the sp energy levels are
randomly distributed around the Fermi energy to mimic those of nuclei obtained
via the use of different energy density functionals (EDF’s) was introduced [19]. In
a set consisting of a very large number of randomly generated sp levels for a given
nucleus, some are likely to represent the true situation especially considering the
variation that exists when different EDF’s and pairing schemes are used.
Figure 4 presents an illustration of the similarity between the sp energy levels
of nuclei from Hartree-Fock-Bogoliubov calculations using a Skyrme EDF (SkO )
[20–22] and those of the RS model. One advantage of this model is that using
M. A. A. Mamun et al.
Fig. 2 Probability distribution of the pairing gap (left) and the gap as a function of temperature
(right) in the constant spacing (CS) model. Figure adapted from [19]
Fig. 3 Excitation energies (a) and specific heats at constant volume (b) with the gaps shown in
Fig. 2. Figure adapted from [19]
here, the second order phase transition present for Δ mp is considerably altered by
fluctuations. Notably, the C V vs T curve is devoid of a discontinuity at T c with
smoothly varying gaps.
3 The Random Spacing Model
Recently, the random spacing (RS) model in which the sp energy levels are
randomly distributed around the Fermi energy to mimic those of nuclei obtained
via the use of different energy density functionals (EDF’s) was introduced [19]. In
a set consisting of a very large number of randomly generated sp levels for a given
nucleus, some are likely to represent the true situation especially considering the
variation that exists when different EDF’s and pairing schemes are used.
Figure 4 presents an illustration of the similarity between the sp energy levels
of nuclei from Hartree-Fock-Bogoliubov calculations using a Skyrme EDF (SkO )
[20–22] and those of the RS model. One advantage of this model is that using