

2 Dynamic Modelling of Reactive Fluidized Bed Systems Using …
61
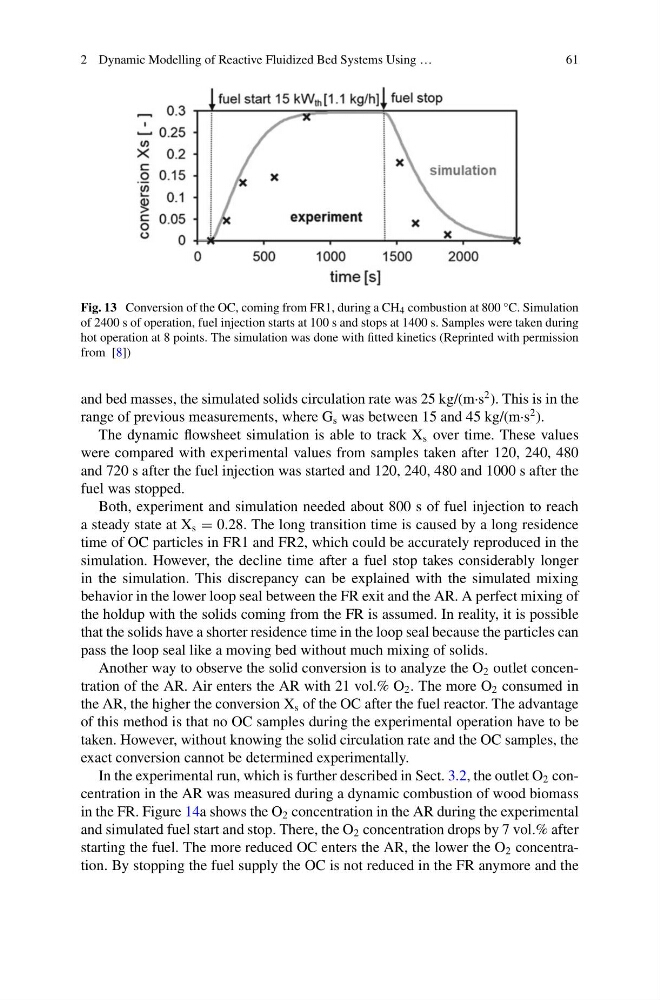
Fig. 13 Conversion of the OC, coming from FR1, during a CH 4 combustion at 800 °C. Simulation
of 2400 s of operation, fuel injection starts at 100 s and stops at 1400 s. Samples were taken during
hot operation at 8 points. The simulation was done with fitted kinetics (Reprinted with permission
from [8])
and bed masses, the simulated solids circulation rate was 25 kg/(m·s
2 ). This is in the
range of previous measurements, where G s was between 15 and 45 kg/(m·s
2 ).
The dynamic flowsheet simulation is able to track X s over time. These values
were compared with experimental values from samples taken after 120, 240, 480
and 720 s after the fuel injection was started and 120, 240, 480 and 1000 s after the
fuel was stopped.
Both, experiment and simulation needed about 800 s of fuel injection to reach
a steady state at X s = 0.28. The long transition time is caused by a long residence
time of OC particles in FR1 and FR2, which could be accurately reproduced in the
simulation. However, the decline time after a fuel stop takes considerably longer
in the simulation. This discrepancy can be explained with the simulated mixing
behavior in the lower loop seal between the FR exit and the AR. A perfect mixing of
the holdup with the solids coming from the FR is assumed. In reality, it is possible
that the solids have a shorter residence time in the loop seal because the particles can
pass the loop seal like a moving bed without much mixing of solids.
Another way to observe the solid conversion is to analyze the O 2 outlet concentration of the AR. Air enters the AR with 21 vol.% O 2 . The more O 2 consumed in
the AR, the higher the conversion X s of the OC after the fuel reactor. The advantage
of this method is that no OC samples during the experimental operation have to be
taken. However, without knowing the solid circulation rate and the OC samples, the
exact conversion cannot be determined experimentally.
In the experimental run, which is further described in Sect. 3.2, the outlet O 2 concentration in the AR was measured during a dynamic combustion of wood biomass
in the FR. Figure 14a shows the O 2 concentration in the AR during the experimental
and simulated fuel start and stop. There, the O 2 concentration drops by 7 vol.% after
starting the fuel. The more reduced OC enters the AR, the lower the O 2 concentration. By stopping the fuel supply the OC is not reduced in the FR anymore and the
61
Fig. 13 Conversion of the OC, coming from FR1, during a CH 4 combustion at 800 °C. Simulation
of 2400 s of operation, fuel injection starts at 100 s and stops at 1400 s. Samples were taken during
hot operation at 8 points. The simulation was done with fitted kinetics (Reprinted with permission
from [8])
and bed masses, the simulated solids circulation rate was 25 kg/(m·s
2 ). This is in the
range of previous measurements, where G s was between 15 and 45 kg/(m·s
2 ).
The dynamic flowsheet simulation is able to track X s over time. These values
were compared with experimental values from samples taken after 120, 240, 480
and 720 s after the fuel injection was started and 120, 240, 480 and 1000 s after the
fuel was stopped.
Both, experiment and simulation needed about 800 s of fuel injection to reach
a steady state at X s = 0.28. The long transition time is caused by a long residence
time of OC particles in FR1 and FR2, which could be accurately reproduced in the
simulation. However, the decline time after a fuel stop takes considerably longer
in the simulation. This discrepancy can be explained with the simulated mixing
behavior in the lower loop seal between the FR exit and the AR. A perfect mixing of
the holdup with the solids coming from the FR is assumed. In reality, it is possible
that the solids have a shorter residence time in the loop seal because the particles can
pass the loop seal like a moving bed without much mixing of solids.
Another way to observe the solid conversion is to analyze the O 2 outlet concentration of the AR. Air enters the AR with 21 vol.% O 2 . The more O 2 consumed in
the AR, the higher the conversion X s of the OC after the fuel reactor. The advantage
of this method is that no OC samples during the experimental operation have to be
taken. However, without knowing the solid circulation rate and the OC samples, the
exact conversion cannot be determined experimentally.
In the experimental run, which is further described in Sect. 3.2, the outlet O 2 concentration in the AR was measured during a dynamic combustion of wood biomass
in the FR. Figure 14a shows the O 2 concentration in the AR during the experimental
and simulated fuel start and stop. There, the O 2 concentration drops by 7 vol.% after
starting the fuel. The more reduced OC enters the AR, the lower the O 2 concentration. By stopping the fuel supply the OC is not reduced in the FR anymore and the