

62
L. Lindmüller et al.
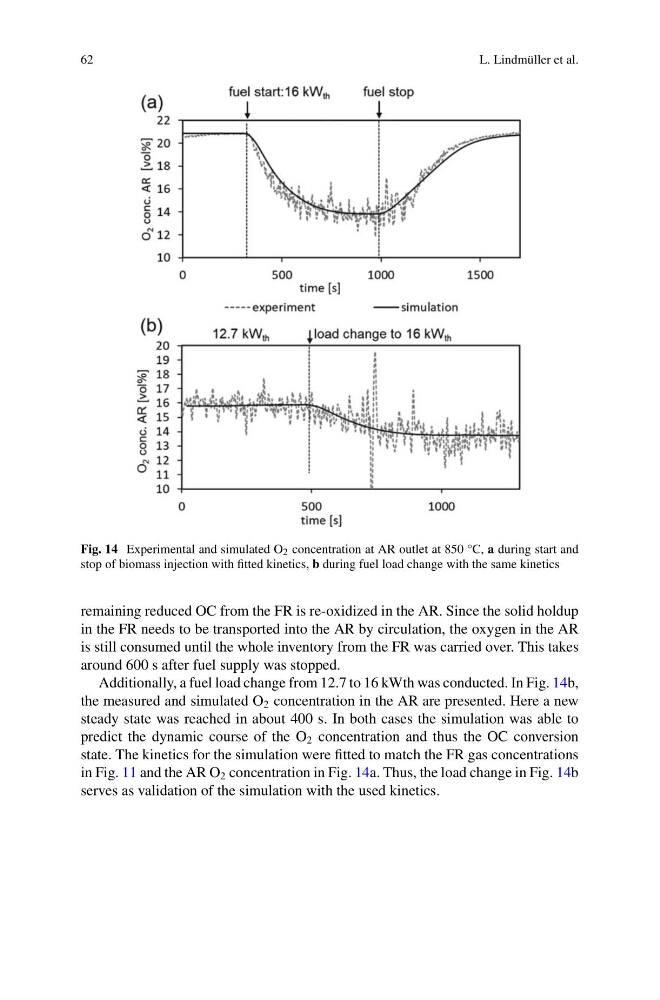
Fig. 14 Experimental and simulated O 2 concentration at AR outlet at 850 °C, a during start and
stop of biomass injection with fitted kinetics, b during fuel load change with the same kinetics
remaining reduced OC from the FR is re-oxidized in the AR. Since the solid holdup
in the FR needs to be transported into the AR by circulation, the oxygen in the AR
is still consumed until the whole inventory from the FR was carried over. This takes
around 600 s after fuel supply was stopped.
Additionally, a fuel load change from 12.7 to 16 kWth was conducted. In Fig. 14b,
the measured and simulated O 2 concentration in the AR are presented. Here a new
steady state was reached in about 400 s. In both cases the simulation was able to
predict the dynamic course of the O 2 concentration and thus the OC conversion
state. The kinetics for the simulation were fitted to match the FR gas concentrations
in Fig. 11 and the AR O 2 concentration in Fig. 14a. Thus, the load change in Fig. 14b
serves as validation of the simulation with the used kinetics.
L. Lindmüller et al.
Fig. 14 Experimental and simulated O 2 concentration at AR outlet at 850 °C, a during start and
stop of biomass injection with fitted kinetics, b during fuel load change with the same kinetics
remaining reduced OC from the FR is re-oxidized in the AR. Since the solid holdup
in the FR needs to be transported into the AR by circulation, the oxygen in the AR
is still consumed until the whole inventory from the FR was carried over. This takes
around 600 s after fuel supply was stopped.
Additionally, a fuel load change from 12.7 to 16 kWth was conducted. In Fig. 14b,
the measured and simulated O 2 concentration in the AR are presented. Here a new
steady state was reached in about 400 s. In both cases the simulation was able to
predict the dynamic course of the O 2 concentration and thus the OC conversion
state. The kinetics for the simulation were fitted to match the FR gas concentrations
in Fig. 11 and the AR O 2 concentration in Fig. 14a. Thus, the load change in Fig. 14b
serves as validation of the simulation with the used kinetics.