

60
L. Lindmüller et al.
0
2
4
6
8
10
12
14
16
18
20
0
200
400
600
800
0
20
40
60
80
100
CO, H
2 conc. [vol%]
time [s]
CO
2 conc. [vol%]
fuel start 16 kW th [3.1 kg/h]
CO
FR1
CO 2
H 2
CH 4
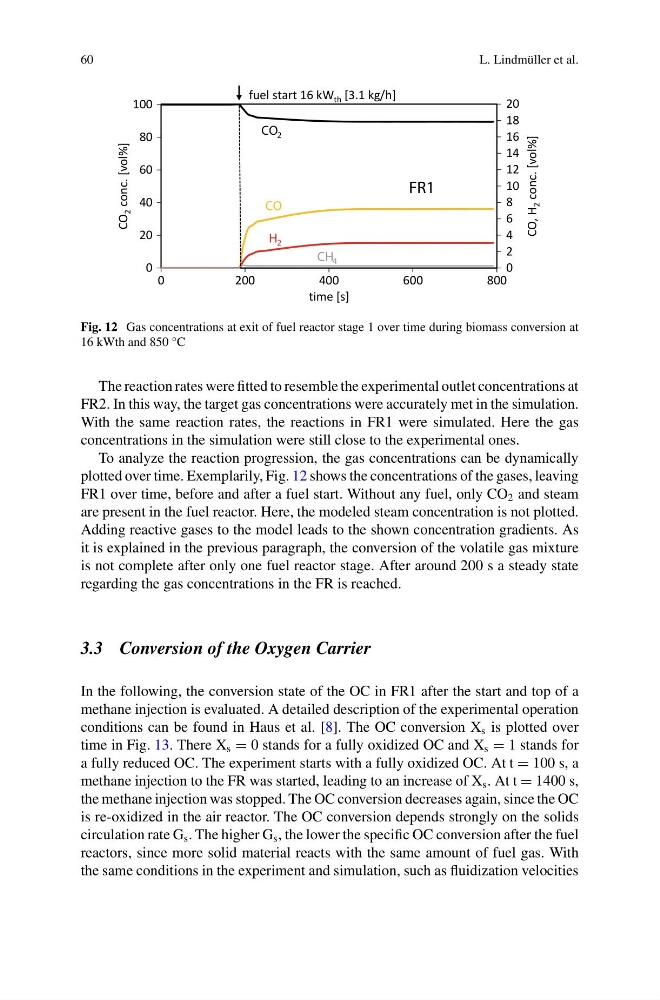
Fig. 12 Gas concentrations at exit of fuel reactor stage 1 over time during biomass conversion at
16 kWth and 850 °C
The reaction rates were fitted to resemble the experimental outlet concentrations at
FR2. In this way, the target gas concentrations were accurately met in the simulation.
With the same reaction rates, the reactions in FR1 were simulated. Here the gas
concentrations in the simulation were still close to the experimental ones.
To analyze the reaction progression, the gas concentrations can be dynamically
plotted over time. Exemplarily, Fig. 12 shows the concentrations of the gases, leaving
FR1 over time, before and after a fuel start. Without any fuel, only CO 2 and steam
are present in the fuel reactor. Here, the modeled steam concentration is not plotted.
Adding reactive gases to the model leads to the shown concentration gradients. As
it is explained in the previous paragraph, the conversion of the volatile gas mixture
is not complete after only one fuel reactor stage. After around 200 s a steady state
regarding the gas concentrations in the FR is reached.
3.3 Conversion of the Oxygen Carrier
In the following, the conversion state of the OC in FR1 after the start and top of a
methane injection is evaluated. A detailed description of the experimental operation
conditions can be found in Haus et al. [8]. The OC conversion X s is plotted over
time in Fig. 13. There X s = 0 stands for a fully oxidized OC and X s = 1 stands for
a fully reduced OC. The experiment starts with a fully oxidized OC. At t = 100 s, a
methane injection to the FR was started, leading to an increase of X s . At t = 1400 s,
the methane injection was stopped. The OC conversion decreases again, since the OC
is re-oxidized in the air reactor. The OC conversion depends strongly on the solids
circulation rate G s . The higher G s , the lower the specific OC conversion after the fuel
reactors, since more solid material reacts with the same amount of fuel gas. With
the same conditions in the experiment and simulation, such as fluidization velocities
L. Lindmüller et al.
0
2
4
6
8
10
12
14
16
18
20
0
200
400
600
800
0
20
40
60
80
100
CO, H
2 conc. [vol%]
time [s]
CO
2 conc. [vol%]
fuel start 16 kW th [3.1 kg/h]
CO
FR1
CO 2
H 2
CH 4
Fig. 12 Gas concentrations at exit of fuel reactor stage 1 over time during biomass conversion at
16 kWth and 850 °C
The reaction rates were fitted to resemble the experimental outlet concentrations at
FR2. In this way, the target gas concentrations were accurately met in the simulation.
With the same reaction rates, the reactions in FR1 were simulated. Here the gas
concentrations in the simulation were still close to the experimental ones.
To analyze the reaction progression, the gas concentrations can be dynamically
plotted over time. Exemplarily, Fig. 12 shows the concentrations of the gases, leaving
FR1 over time, before and after a fuel start. Without any fuel, only CO 2 and steam
are present in the fuel reactor. Here, the modeled steam concentration is not plotted.
Adding reactive gases to the model leads to the shown concentration gradients. As
it is explained in the previous paragraph, the conversion of the volatile gas mixture
is not complete after only one fuel reactor stage. After around 200 s a steady state
regarding the gas concentrations in the FR is reached.
3.3 Conversion of the Oxygen Carrier
In the following, the conversion state of the OC in FR1 after the start and top of a
methane injection is evaluated. A detailed description of the experimental operation
conditions can be found in Haus et al. [8]. The OC conversion X s is plotted over
time in Fig. 13. There X s = 0 stands for a fully oxidized OC and X s = 1 stands for
a fully reduced OC. The experiment starts with a fully oxidized OC. At t = 100 s, a
methane injection to the FR was started, leading to an increase of X s . At t = 1400 s,
the methane injection was stopped. The OC conversion decreases again, since the OC
is re-oxidized in the air reactor. The OC conversion depends strongly on the solids
circulation rate G s . The higher G s , the lower the specific OC conversion after the fuel
reactors, since more solid material reacts with the same amount of fuel gas. With
the same conditions in the experiment and simulation, such as fluidization velocities