

2 Dynamic Modelling of Reactive Fluidized Bed Systems Using …
59
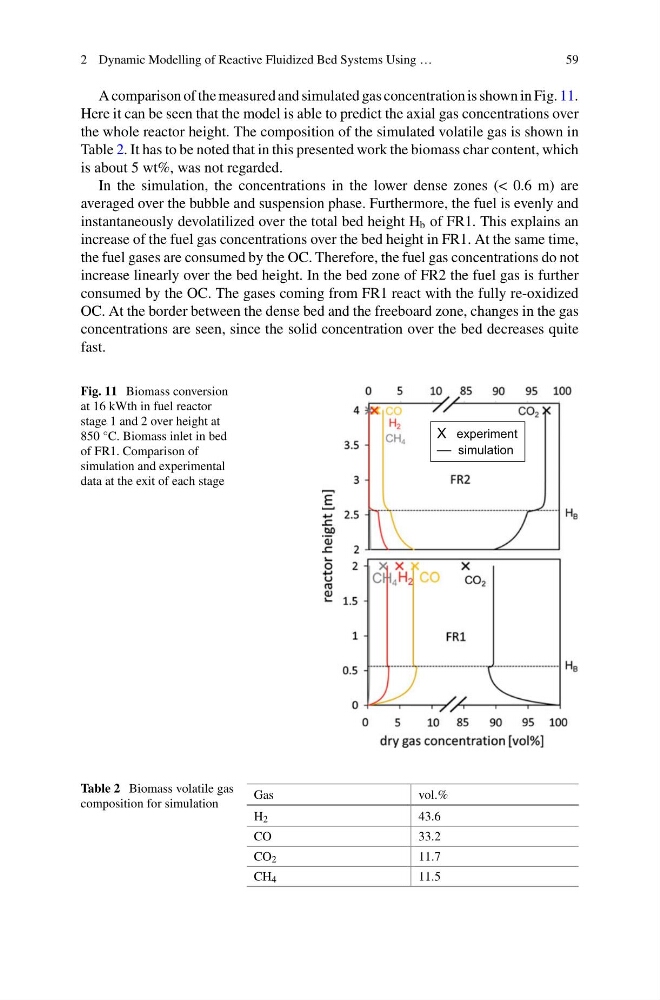
A comparison of the measured and simulated gas concentration is shown in Fig. 11.
Here it can be seen that the model is able to predict the axial gas concentrations over
the whole reactor height. The composition of the simulated volatile gas is shown in
Table 2. It has to be noted that in this presented work the biomass char content, which
is about 5 wt%, was not regarded.
In the simulation, the concentrations in the lower dense zones (< 0.6 m) are
averaged over the bubble and suspension phase. Furthermore, the fuel is evenly and
instantaneously devolatilized over the total bed height H b of FR1. This explains an
increase of the fuel gas concentrations over the bed height in FR1. At the same time,
the fuel gases are consumed by the OC. Therefore, the fuel gas concentrations do not
increase linearly over the bed height. In the bed zone of FR2 the fuel gas is further
consumed by the OC. The gases coming from FR1 react with the fully re-oxidized
OC. At the border between the dense bed and the freeboard zone, changes in the gas
concentrations are seen, since the solid concentration over the bed decreases quite
fast.
Fig. 11 Biomass conversion
at 16 kWth in fuel reactor
stage 1 and 2 over height at
850 °C. Biomass inlet in bed
of FR1. Comparison of
simulation and experimental
data at the exit of each stage
X experiment
— simulation
Table 2 Biomass volatile gas
composition for simulation
Gas
vol.%
H 2
43.6
CO
33.2
CO 2
11.7
CH 4
11.5
59
A comparison of the measured and simulated gas concentration is shown in Fig. 11.
Here it can be seen that the model is able to predict the axial gas concentrations over
the whole reactor height. The composition of the simulated volatile gas is shown in
Table 2. It has to be noted that in this presented work the biomass char content, which
is about 5 wt%, was not regarded.
In the simulation, the concentrations in the lower dense zones (< 0.6 m) are
averaged over the bubble and suspension phase. Furthermore, the fuel is evenly and
instantaneously devolatilized over the total bed height H b of FR1. This explains an
increase of the fuel gas concentrations over the bed height in FR1. At the same time,
the fuel gases are consumed by the OC. Therefore, the fuel gas concentrations do not
increase linearly over the bed height. In the bed zone of FR2 the fuel gas is further
consumed by the OC. The gases coming from FR1 react with the fully re-oxidized
OC. At the border between the dense bed and the freeboard zone, changes in the gas
concentrations are seen, since the solid concentration over the bed decreases quite
fast.
Fig. 11 Biomass conversion
at 16 kWth in fuel reactor
stage 1 and 2 over height at
850 °C. Biomass inlet in bed
of FR1. Comparison of
simulation and experimental
data at the exit of each stage
X experiment
— simulation
Table 2 Biomass volatile gas
composition for simulation
Gas
vol.%
H 2
43.6
CO
33.2
CO 2
11.7
CH 4
11.5