

58
L. Lindmüller et al.
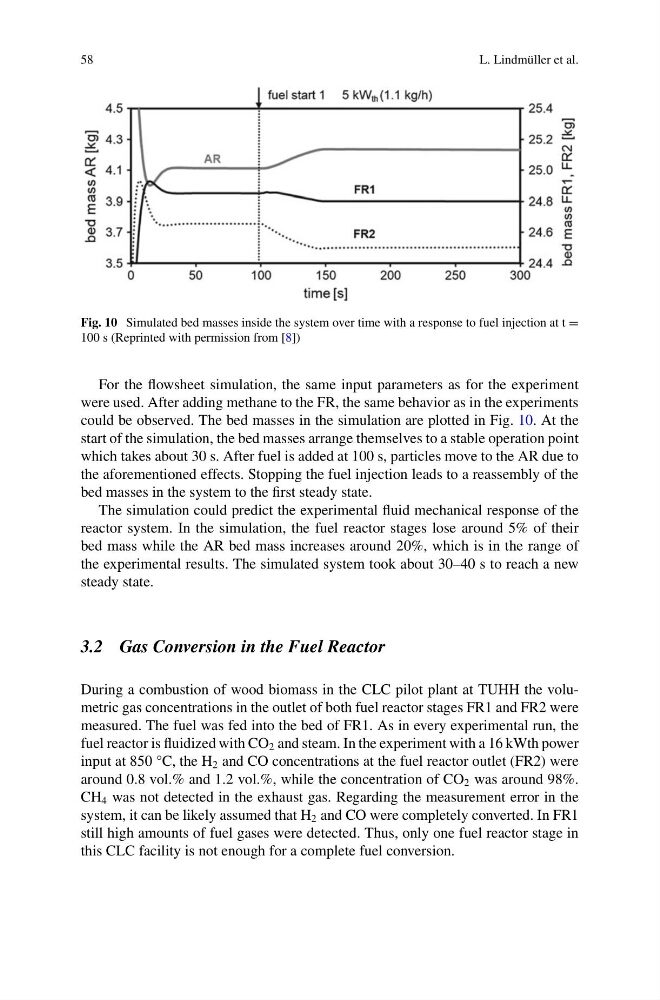
Fig. 10 Simulated bed masses inside the system over time with a response to fuel injection at t =
100 s (Reprinted with permission from [8])
For the flowsheet simulation, the same input parameters as for the experiment
were used. After adding methane to the FR, the same behavior as in the experiments
could be observed. The bed masses in the simulation are plotted in Fig. 10. At the
start of the simulation, the bed masses arrange themselves to a stable operation point
which takes about 30 s. After fuel is added at 100 s, particles move to the AR due to
the aforementioned effects. Stopping the fuel injection leads to a reassembly of the
bed masses in the system to the first steady state.
The simulation could predict the experimental fluid mechanical response of the
reactor system. In the simulation, the fuel reactor stages lose around 5% of their
bed mass while the AR bed mass increases around 20%, which is in the range of
the experimental results. The simulated system took about 30–40 s to reach a new
steady state.
3.2 Gas Conversion in the Fuel Reactor
During a combustion of wood biomass in the CLC pilot plant at TUHH the volumetric gas concentrations in the outlet of both fuel reactor stages FR1 and FR2 were
measured. The fuel was fed into the bed of FR1. As in every experimental run, the
fuel reactor is fluidized with CO 2 and steam. In the experiment with a 16 kWth power
input at 850 °C, the H 2 and CO concentrations at the fuel reactor outlet (FR2) were
around 0.8 vol.% and 1.2 vol.%, while the concentration of CO 2 was around 98%.
CH 4 was not detected in the exhaust gas. Regarding the measurement error in the
system, it can be likely assumed that H 2 and CO were completely converted. In FR1
still high amounts of fuel gases were detected. Thus, only one fuel reactor stage in
this CLC facility is not enough for a complete fuel conversion.
L. Lindmüller et al.
Fig. 10 Simulated bed masses inside the system over time with a response to fuel injection at t =
100 s (Reprinted with permission from [8])
For the flowsheet simulation, the same input parameters as for the experiment
were used. After adding methane to the FR, the same behavior as in the experiments
could be observed. The bed masses in the simulation are plotted in Fig. 10. At the
start of the simulation, the bed masses arrange themselves to a stable operation point
which takes about 30 s. After fuel is added at 100 s, particles move to the AR due to
the aforementioned effects. Stopping the fuel injection leads to a reassembly of the
bed masses in the system to the first steady state.
The simulation could predict the experimental fluid mechanical response of the
reactor system. In the simulation, the fuel reactor stages lose around 5% of their
bed mass while the AR bed mass increases around 20%, which is in the range of
the experimental results. The simulated system took about 30–40 s to reach a new
steady state.
3.2 Gas Conversion in the Fuel Reactor
During a combustion of wood biomass in the CLC pilot plant at TUHH the volumetric gas concentrations in the outlet of both fuel reactor stages FR1 and FR2 were
measured. The fuel was fed into the bed of FR1. As in every experimental run, the
fuel reactor is fluidized with CO 2 and steam. In the experiment with a 16 kWth power
input at 850 °C, the H 2 and CO concentrations at the fuel reactor outlet (FR2) were
around 0.8 vol.% and 1.2 vol.%, while the concentration of CO 2 was around 98%.
CH 4 was not detected in the exhaust gas. Regarding the measurement error in the
system, it can be likely assumed that H 2 and CO were completely converted. In FR1
still high amounts of fuel gases were detected. Thus, only one fuel reactor stage in
this CLC facility is not enough for a complete fuel conversion.