

15 Compartmental Population Balances by Means of Monte Carlo Methods
541
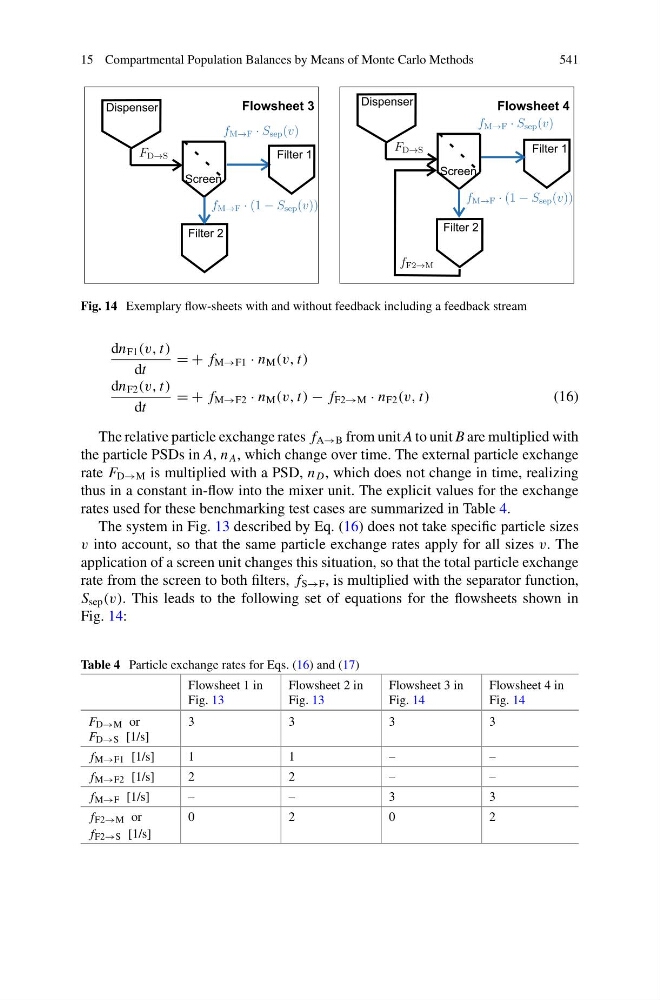
Fig. 14 Exemplary flow-sheets with and without feedback including a feedback stream
dn F1 (v, t)
dt
= + f M→F1 · n M (v, t)
dn F2 (v, t)
dt
= + f M→F2 · n M (v, t) − f F2→M · n F2 (v, t)
(16)
The relative particle exchange rates f A→B from unit A to unit B are multiplied with
the particle PSDs in A, n A , which change over time. The external particle exchange
rate F D→M is multiplied with a PSD, n D , which does not change in time, realizing
thus in a constant in-flow into the mixer unit. The explicit values for the exchange
rates used for these benchmarking test cases are summarized in Table 4.
The system in Fig. 13 described by Eq. (16) does not take specific particle sizes
v into account, so that the same particle exchange rates apply for all sizes v. The
application of a screen unit changes this situation, so that the total particle exchange
rate from the screen to both filters, f S→F , is multiplied with the separator function,
S sep (v). This leads to the following set of equations for the flowsheets shown in
Fig. 14:
Table 4 Particle exchange rates for Eqs. (16) and (17)
Flowsheet 1 in
Fig. 13
Flowsheet 2 in
Fig. 13
Flowsheet 3 in
Fig. 14
Flowsheet 4 in
Fig. 14
F D→M or
F D→S [1/s]
3
3
3
3
f M→F1 [1/s]
1
1
–
–
f M→F2 [1/s]
2
2
–
–
f M→F [1/s]
–
–
3
3
f F2→M or
f F2→S [1/s]
0
2
0
2
541
Fig. 14 Exemplary flow-sheets with and without feedback including a feedback stream
dn F1 (v, t)
dt
= + f M→F1 · n M (v, t)
dn F2 (v, t)
dt
= + f M→F2 · n M (v, t) − f F2→M · n F2 (v, t)
(16)
The relative particle exchange rates f A→B from unit A to unit B are multiplied with
the particle PSDs in A, n A , which change over time. The external particle exchange
rate F D→M is multiplied with a PSD, n D , which does not change in time, realizing
thus in a constant in-flow into the mixer unit. The explicit values for the exchange
rates used for these benchmarking test cases are summarized in Table 4.
The system in Fig. 13 described by Eq. (16) does not take specific particle sizes
v into account, so that the same particle exchange rates apply for all sizes v. The
application of a screen unit changes this situation, so that the total particle exchange
rate from the screen to both filters, f S→F , is multiplied with the separator function,
S sep (v). This leads to the following set of equations for the flowsheets shown in
Fig. 14:
Table 4 Particle exchange rates for Eqs. (16) and (17)
Flowsheet 1 in
Fig. 13
Flowsheet 2 in
Fig. 13
Flowsheet 3 in
Fig. 14
Flowsheet 4 in
Fig. 14
F D→M or
F D→S [1/s]
3
3
3
3
f M→F1 [1/s]
1
1
–
–
f M→F2 [1/s]
2
2
–
–
f M→F [1/s]
–
–
3
3
f F2→M or
f F2→S [1/s]
0
2
0
2