

540
G. Kotalczyk and F. E. Kruis
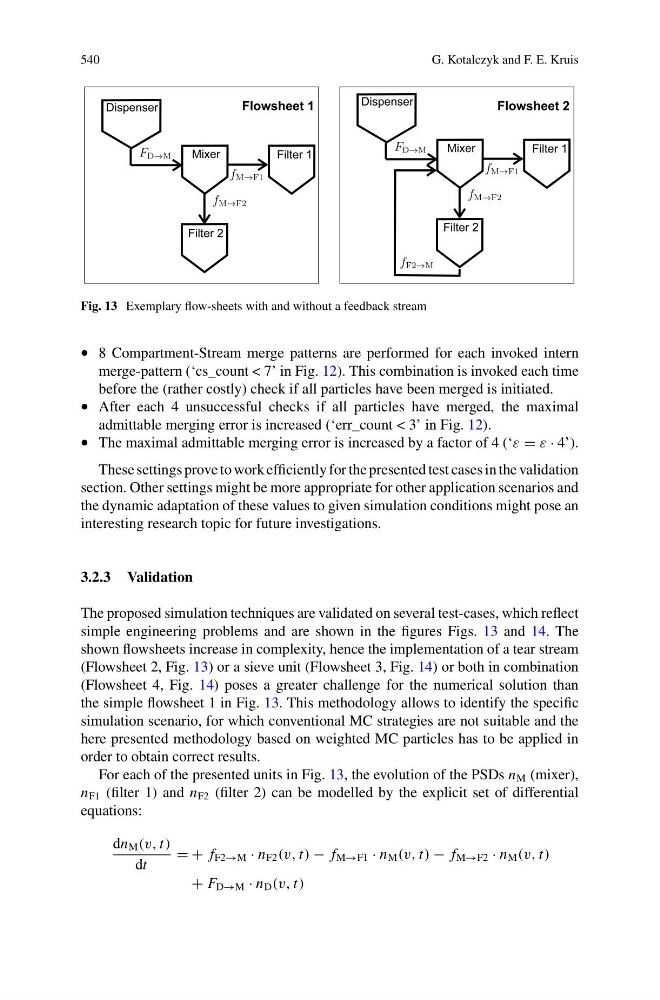
Fig. 13 Exemplary flow-sheets with and without a feedback stream
• 8 Compartment-Stream merge patterns are performed for each invoked intern
merge-pattern (‘cs_count < 7’ in Fig. 12). This combination is invoked each time
before the (rather costly) check if all particles have been merged is initiated.
• After each 4 unsuccessful checks if all particles have merged, the maximal
admittable merging error is increased (‘err_count < 3’ in Fig. 12).
• The maximal admittable merging error is increased by a factor of 4 (‘ε = ε · 4’).
These settings prove to work efficiently for the presented test cases in the validation
section. Other settings might be more appropriate for other application scenarios and
the dynamic adaptation of these values to given simulation conditions might pose an
interesting research topic for future investigations.
3.2.3 Validation
The proposed simulation techniques are validated on several test-cases, which reflect
simple engineering problems and are shown in the figures Figs. 13 and 14. The
shown flowsheets increase in complexity, hence the implementation of a tear stream
(Flowsheet 2, Fig. 13) or a sieve unit (Flowsheet 3, Fig. 14) or both in combination
(Flowsheet 4, Fig. 14) poses a greater challenge for the numerical solution than
the simple flowsheet 1 in Fig. 13. This methodology allows to identify the specific
simulation scenario, for which conventional MC strategies are not suitable and the
here presented methodology based on weighted MC particles has to be applied in
order to obtain correct results.
For each of the presented units in Fig. 13, the evolution of the PSDs n M (mixer),
n F1 (filter 1) and n F2 (filter 2) can be modelled by the explicit set of differential
equations:
dn M (v, t)
dt
= + f F2→M · n F2 (v, t) − f M→F1 · n M (v, t) − f M→F2 · n M (v, t)
+ F D→M · n D (v, t)
G. Kotalczyk and F. E. Kruis
Fig. 13 Exemplary flow-sheets with and without a feedback stream
• 8 Compartment-Stream merge patterns are performed for each invoked intern
merge-pattern (‘cs_count < 7’ in Fig. 12). This combination is invoked each time
before the (rather costly) check if all particles have been merged is initiated.
• After each 4 unsuccessful checks if all particles have merged, the maximal
admittable merging error is increased (‘err_count < 3’ in Fig. 12).
• The maximal admittable merging error is increased by a factor of 4 (‘ε = ε · 4’).
These settings prove to work efficiently for the presented test cases in the validation
section. Other settings might be more appropriate for other application scenarios and
the dynamic adaptation of these values to given simulation conditions might pose an
interesting research topic for future investigations.
3.2.3 Validation
The proposed simulation techniques are validated on several test-cases, which reflect
simple engineering problems and are shown in the figures Figs. 13 and 14. The
shown flowsheets increase in complexity, hence the implementation of a tear stream
(Flowsheet 2, Fig. 13) or a sieve unit (Flowsheet 3, Fig. 14) or both in combination
(Flowsheet 4, Fig. 14) poses a greater challenge for the numerical solution than
the simple flowsheet 1 in Fig. 13. This methodology allows to identify the specific
simulation scenario, for which conventional MC strategies are not suitable and the
here presented methodology based on weighted MC particles has to be applied in
order to obtain correct results.
For each of the presented units in Fig. 13, the evolution of the PSDs n M (mixer),
n F1 (filter 1) and n F2 (filter 2) can be modelled by the explicit set of differential
equations:
dn M (v, t)
dt
= + f F2→M · n F2 (v, t) − f M→F1 · n M (v, t) − f M→F2 · n M (v, t)
+ F D→M · n D (v, t)