

14 Numerical Methods for Coupled Population Balance Systems …
499
0
500
1000
1500
2000
0
50 100 150 200 250
0
50 100 150 200 250
time [s]
average diameter [μm]
average diameter [μm]
●
κ = 5000
κ = 6000
κ = 7000
κ = 8000
κ = 9000
κ = 10000
κ = 15000
● ● ● ● ● ● ● ● ● ● ● ● ● ● ● ● ● ● ● ● ● ● ● ● ● ● ●
0
500
1000
1500
2000
time [s]
●
κ = 5000
κ = 6000
κ = 7000
κ = 8000
κ = 9000
κ = 10000
κ = 15000
● ● ● ● ● ● ● ● ● ● ● ● ● ● ● ● ● ● ● ● ● ● ● ● ● ● ●
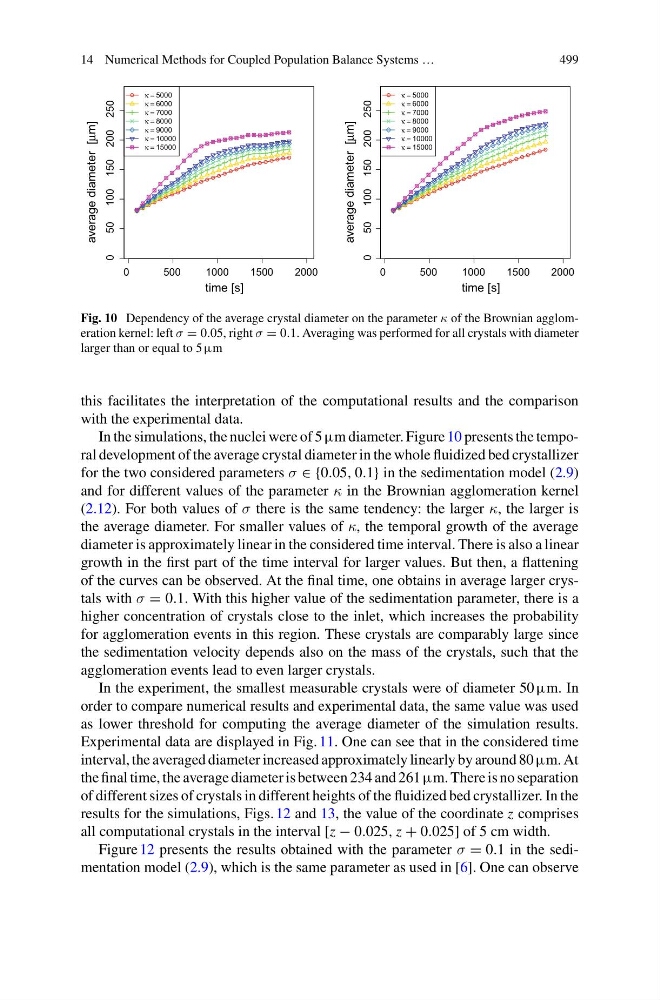
Fig. 10 Dependency of the average crystal diameter on the parameter κ of the Brownian agglomeration kernel: left σ = 0.05, right σ = 0.1. Averaging was performed for all crystals with diameter
larger than or equal to 5 μm
this facilitates the interpretation of the computational results and the comparison
with the experimental data.
In the simulations, the nuclei were of 5 μm diameter. Figure 10 presents the temporal development of the average crystal diameter in the whole fluidized bed crystallizer
for the two considered parameters σ ∈ {0.05, 0.1} in the sedimentation model (2.9)
and for different values of the parameter κ in the Brownian agglomeration kernel
(2.12). For both values of σ there is the same tendency: the larger κ, the larger is
the average diameter. For smaller values of κ, the temporal growth of the average
diameter is approximately linear in the considered time interval. There is also a linear
growth in the first part of the time interval for larger values. But then, a flattening
of the curves can be observed. At the final time, one obtains in average larger crystals with σ = 0.1. With this higher value of the sedimentation parameter, there is a
higher concentration of crystals close to the inlet, which increases the probability
for agglomeration events in this region. These crystals are comparably large since
the sedimentation velocity depends also on the mass of the crystals, such that the
agglomeration events lead to even larger crystals.
In the experiment, the smallest measurable crystals were of diameter 50 μm. In
order to compare numerical results and experimental data, the same value was used
as lower threshold for computing the average diameter of the simulation results.
Experimental data are displayed in Fig. 11. One can see that in the considered time
interval, the averaged diameter increased approximately linearly by around 80 μm. At
the final time, the average diameter is between 234 and 261 μm. There is no separation
of different sizes of crystals in different heights of the fluidized bed crystallizer. In the
results for the simulations, Figs. 12 and 13, the value of the coordinate z comprises
all computational crystals in the interval [z − 0.025, z + 0.025] of 5 cm width.
Figure 12 presents the results obtained with the parameter σ = 0.1 in the sedimentation model (2.9), which is the same parameter as used in [6]. One can observe
499
0
500
1000
1500
2000
0
50 100 150 200 250
0
50 100 150 200 250
time [s]
average diameter [μm]
average diameter [μm]
●
κ = 5000
κ = 6000
κ = 7000
κ = 8000
κ = 9000
κ = 10000
κ = 15000
● ● ● ● ● ● ● ● ● ● ● ● ● ● ● ● ● ● ● ● ● ● ● ● ● ● ●
0
500
1000
1500
2000
time [s]
●
κ = 5000
κ = 6000
κ = 7000
κ = 8000
κ = 9000
κ = 10000
κ = 15000
● ● ● ● ● ● ● ● ● ● ● ● ● ● ● ● ● ● ● ● ● ● ● ● ● ● ●
Fig. 10 Dependency of the average crystal diameter on the parameter κ of the Brownian agglomeration kernel: left σ = 0.05, right σ = 0.1. Averaging was performed for all crystals with diameter
larger than or equal to 5 μm
this facilitates the interpretation of the computational results and the comparison
with the experimental data.
In the simulations, the nuclei were of 5 μm diameter. Figure 10 presents the temporal development of the average crystal diameter in the whole fluidized bed crystallizer
for the two considered parameters σ ∈ {0.05, 0.1} in the sedimentation model (2.9)
and for different values of the parameter κ in the Brownian agglomeration kernel
(2.12). For both values of σ there is the same tendency: the larger κ, the larger is
the average diameter. For smaller values of κ, the temporal growth of the average
diameter is approximately linear in the considered time interval. There is also a linear
growth in the first part of the time interval for larger values. But then, a flattening
of the curves can be observed. At the final time, one obtains in average larger crystals with σ = 0.1. With this higher value of the sedimentation parameter, there is a
higher concentration of crystals close to the inlet, which increases the probability
for agglomeration events in this region. These crystals are comparably large since
the sedimentation velocity depends also on the mass of the crystals, such that the
agglomeration events lead to even larger crystals.
In the experiment, the smallest measurable crystals were of diameter 50 μm. In
order to compare numerical results and experimental data, the same value was used
as lower threshold for computing the average diameter of the simulation results.
Experimental data are displayed in Fig. 11. One can see that in the considered time
interval, the averaged diameter increased approximately linearly by around 80 μm. At
the final time, the average diameter is between 234 and 261 μm. There is no separation
of different sizes of crystals in different heights of the fluidized bed crystallizer. In the
results for the simulations, Figs. 12 and 13, the value of the coordinate z comprises
all computational crystals in the interval [z − 0.025, z + 0.025] of 5 cm width.
Figure 12 presents the results obtained with the parameter σ = 0.1 in the sedimentation model (2.9), which is the same parameter as used in [6]. One can observe