

494
R. Ahrens et al.
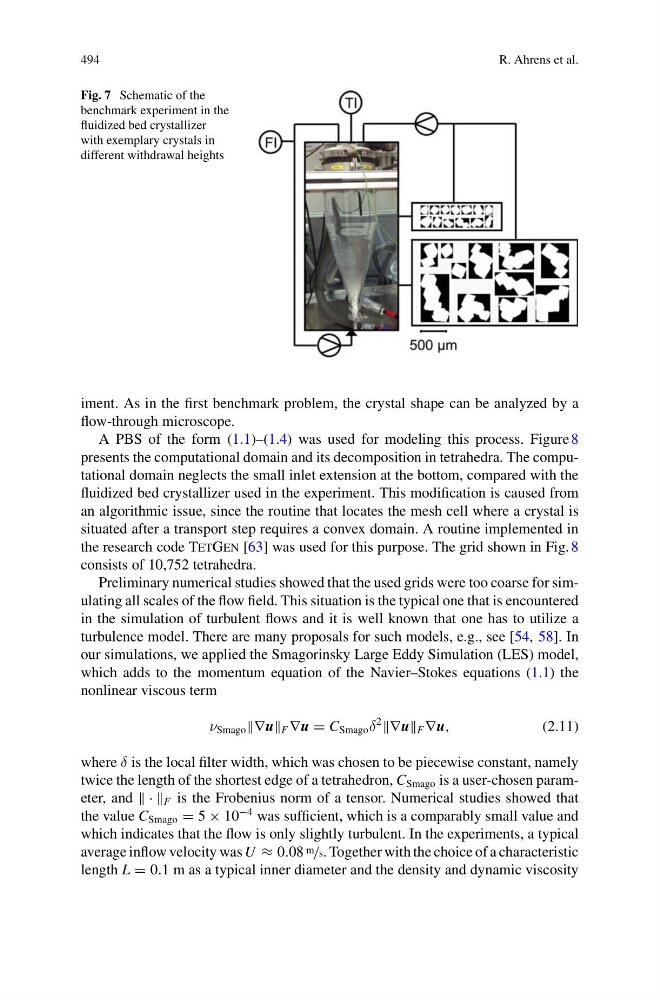
Fig. 7 Schematic of the
benchmark experiment in the
fluidized bed crystallizer
with exemplary crystals in
different withdrawal heights
iment. As in the first benchmark problem, the crystal shape can be analyzed by a
flow-through microscope.
A PBS of the form (1.1)–(1.4) was used for modeling this process. Figure 8
presents the computational domain and its decomposition in tetrahedra. The computational domain neglects the small inlet extension at the bottom, compared with the
fluidized bed crystallizer used in the experiment. This modification is caused from
an algorithmic issue, since the routine that locates the mesh cell where a crystal is
situated after a transport step requires a convex domain. A routine implemented in
the research code TetGen [63] was used for this purpose. The grid shown in Fig. 8
consists of 10,752 tetrahedra.
Preliminary numerical studies showed that the used grids were too coarse for simulating all scales of the flow field. This situation is the typical one that is encountered
in the simulation of turbulent flows and it is well known that one has to utilize a
turbulence model. There are many proposals for such models, e.g., see [54, 58]. In
our simulations, we applied the Smagorinsky Large Eddy Simulation (LES) model,
which adds to the momentum equation of the Navier–Stokes equations (1.1) the
nonlinear viscous term
ν Smago ∇u F ∇u = C Smago δ
2
∇u F ∇u,
(2.11)
where δ is the local filter width, which was chosen to be piecewise constant, namely
twice the length of the shortest edge of a tetrahedron, C Smago is a user-chosen parameter, and · · F is the Frobenius norm of a tensor. Numerical studies showed that
the value C Smago = 5 × 10
−4 was sufficient, which is a comparably small value and
which indicates that the flow is only slightly turbulent. In the experiments, a typical
average inflow velocity was U ≈ 0.08 m /s. Together with the choice of a characteristic
length L = 0.1 m as a typical inner diameter and the density and dynamic viscosity
R. Ahrens et al.
Fig. 7 Schematic of the
benchmark experiment in the
fluidized bed crystallizer
with exemplary crystals in
different withdrawal heights
iment. As in the first benchmark problem, the crystal shape can be analyzed by a
flow-through microscope.
A PBS of the form (1.1)–(1.4) was used for modeling this process. Figure 8
presents the computational domain and its decomposition in tetrahedra. The computational domain neglects the small inlet extension at the bottom, compared with the
fluidized bed crystallizer used in the experiment. This modification is caused from
an algorithmic issue, since the routine that locates the mesh cell where a crystal is
situated after a transport step requires a convex domain. A routine implemented in
the research code TetGen [63] was used for this purpose. The grid shown in Fig. 8
consists of 10,752 tetrahedra.
Preliminary numerical studies showed that the used grids were too coarse for simulating all scales of the flow field. This situation is the typical one that is encountered
in the simulation of turbulent flows and it is well known that one has to utilize a
turbulence model. There are many proposals for such models, e.g., see [54, 58]. In
our simulations, we applied the Smagorinsky Large Eddy Simulation (LES) model,
which adds to the momentum equation of the Navier–Stokes equations (1.1) the
nonlinear viscous term
ν Smago ∇u F ∇u = C Smago δ
2
∇u F ∇u,
(2.11)
where δ is the local filter width, which was chosen to be piecewise constant, namely
twice the length of the shortest edge of a tetrahedron, C Smago is a user-chosen parameter, and · · F is the Frobenius norm of a tensor. Numerical studies showed that
the value C Smago = 5 × 10
−4 was sufficient, which is a comparably small value and
which indicates that the flow is only slightly turbulent. In the experiments, a typical
average inflow velocity was U ≈ 0.08 m /s. Together with the choice of a characteristic
length L = 0.1 m as a typical inner diameter and the density and dynamic viscosity