

470
S. Schiele et al.
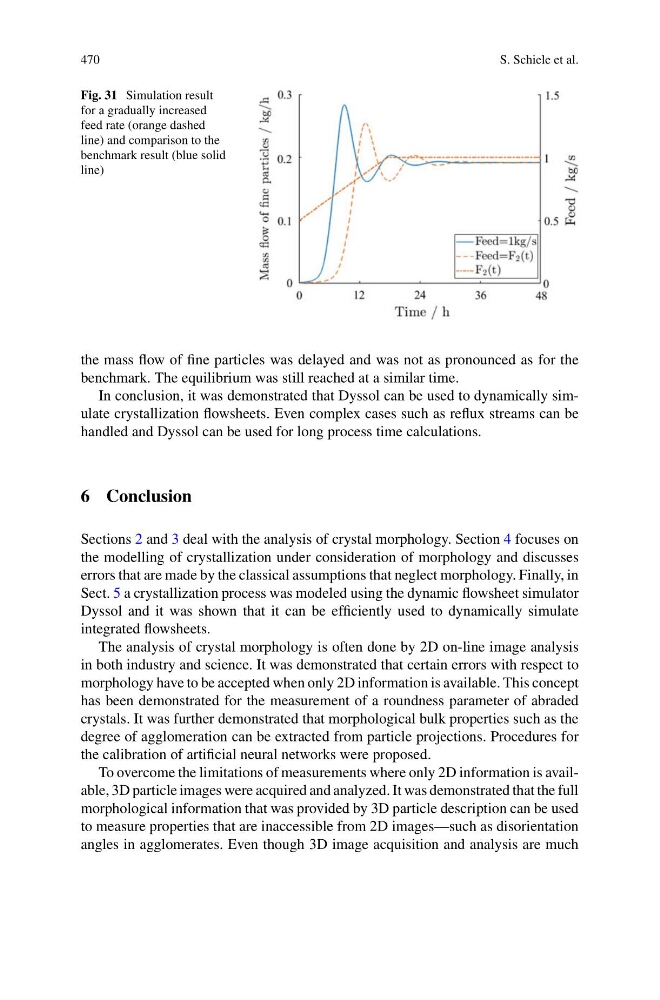
Fig. 31 Simulation result
for a gradually increased
feed rate (orange dashed
line) and comparison to the
benchmark result (blue solid
line)
the mass flow of fine particles was delayed and was not as pronounced as for the
benchmark. The equilibrium was still reached at a similar time.
In conclusion, it was demonstrated that Dyssol can be used to dynamically simulate crystallization flowsheets. Even complex cases such as reflux streams can be
handled and Dyssol can be used for long process time calculations.
6 Conclusion
Sections 2 and 3 deal with the analysis of crystal morphology. Section 4 focuses on
the modelling of crystallization under consideration of morphology and discusses
errors that are made by the classical assumptions that neglect morphology. Finally, in
Sect. 5 a crystallization process was modeled using the dynamic flowsheet simulator
Dyssol and it was shown that it can be efficiently used to dynamically simulate
integrated flowsheets.
The analysis of crystal morphology is often done by 2D on-line image analysis
in both industry and science. It was demonstrated that certain errors with respect to
morphology have to be accepted when only 2D information is available. This concept
has been demonstrated for the measurement of a roundness parameter of abraded
crystals. It was further demonstrated that morphological bulk properties such as the
degree of agglomeration can be extracted from particle projections. Procedures for
the calibration of artificial neural networks were proposed.
To overcome the limitations of measurements where only 2D information is available, 3D particle images were acquired and analyzed. It was demonstrated that the full
morphological information that was provided by 3D particle description can be used
to measure properties that are inaccessible from 2D images—such as disorientation
angles in agglomerates. Even though 3D image acquisition and analysis are much
S. Schiele et al.
Fig. 31 Simulation result
for a gradually increased
feed rate (orange dashed
line) and comparison to the
benchmark result (blue solid
line)
the mass flow of fine particles was delayed and was not as pronounced as for the
benchmark. The equilibrium was still reached at a similar time.
In conclusion, it was demonstrated that Dyssol can be used to dynamically simulate crystallization flowsheets. Even complex cases such as reflux streams can be
handled and Dyssol can be used for long process time calculations.
6 Conclusion
Sections 2 and 3 deal with the analysis of crystal morphology. Section 4 focuses on
the modelling of crystallization under consideration of morphology and discusses
errors that are made by the classical assumptions that neglect morphology. Finally, in
Sect. 5 a crystallization process was modeled using the dynamic flowsheet simulator
Dyssol and it was shown that it can be efficiently used to dynamically simulate
integrated flowsheets.
The analysis of crystal morphology is often done by 2D on-line image analysis
in both industry and science. It was demonstrated that certain errors with respect to
morphology have to be accepted when only 2D information is available. This concept
has been demonstrated for the measurement of a roundness parameter of abraded
crystals. It was further demonstrated that morphological bulk properties such as the
degree of agglomeration can be extracted from particle projections. Procedures for
the calibration of artificial neural networks were proposed.
To overcome the limitations of measurements where only 2D information is available, 3D particle images were acquired and analyzed. It was demonstrated that the full
morphological information that was provided by 3D particle description can be used
to measure properties that are inaccessible from 2D images—such as disorientation
angles in agglomerates. Even though 3D image acquisition and analysis are much