

13 Morphological Modelling and Simulation …
461
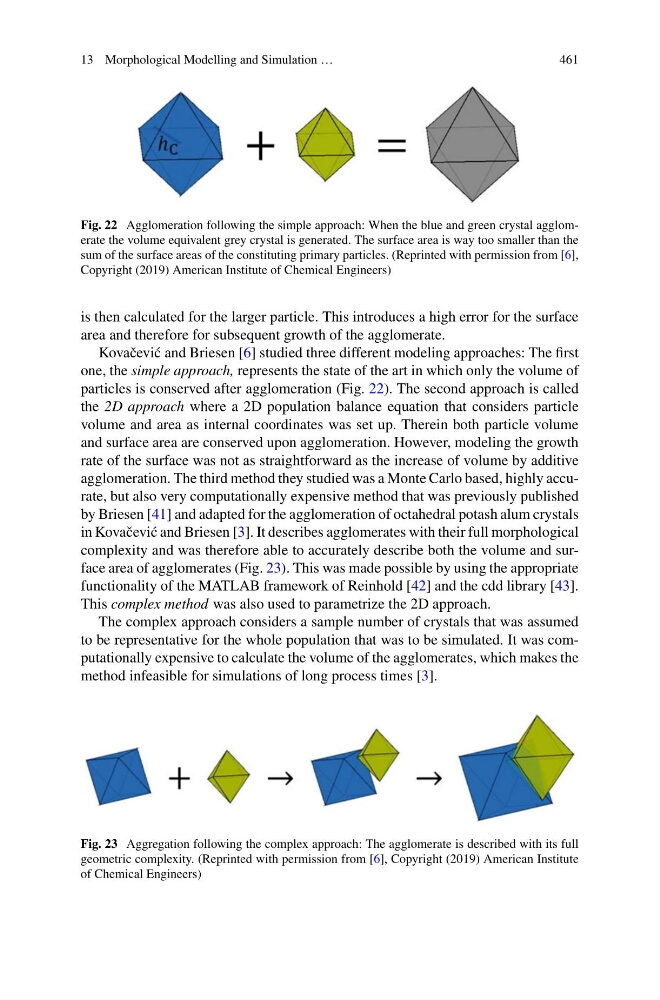
Fig. 22 Agglomeration following the simple approach: When the blue and green crystal agglomerate the volume equivalent grey crystal is generated. The surface area is way too smaller than the
sum of the surface areas of the constituting primary particles. (Reprinted with permission from [6],
Copyright (2019) American Institute of Chemical Engineers)
is then calculated for the larger particle. This introduces a high error for the surface
area and therefore for subsequent growth of the agglomerate.
Kovaˇ cevi´ c and Briesen [6] studied three different modeling approaches: The first
one, the simple approach, represents the state of the art in which only the volume of
particles is conserved after agglomeration (Fig. 22). The second approach is called
the 2D approach where a 2D population balance equation that considers particle
volume and area as internal coordinates was set up. Therein both particle volume
and surface area are conserved upon agglomeration. However, modeling the growth
rate of the surface was not as straightforward as the increase of volume by additive
agglomeration. The third method they studied was a Monte Carlo based, highly accurate, but also very computationally expensive method that was previously published
by Briesen [41] and adapted for the agglomeration of octahedral potash alum crystals
in Kovaˇ cevi´ c and Briesen [3]. It describes agglomerates with their full morphological
complexity and was therefore able to accurately describe both the volume and surface area of agglomerates (Fig. 23). This was made possible by using the appropriate
functionality of the MATLAB framework of Reinhold [42] and the cdd library [43].
This complex method was also used to parametrize the 2D approach.
The complex approach considers a sample number of crystals that was assumed
to be representative for the whole population that was to be simulated. It was computationally expensive to calculate the volume of the agglomerates, which makes the
method infeasible for simulations of long process times [3].
Fig. 23 Aggregation following the complex approach: The agglomerate is described with its full
geometric complexity. (Reprinted with permission from [6], Copyright (2019) American Institute
of Chemical Engineers)
461
Fig. 22 Agglomeration following the simple approach: When the blue and green crystal agglomerate the volume equivalent grey crystal is generated. The surface area is way too smaller than the
sum of the surface areas of the constituting primary particles. (Reprinted with permission from [6],
Copyright (2019) American Institute of Chemical Engineers)
is then calculated for the larger particle. This introduces a high error for the surface
area and therefore for subsequent growth of the agglomerate.
Kovaˇ cevi´ c and Briesen [6] studied three different modeling approaches: The first
one, the simple approach, represents the state of the art in which only the volume of
particles is conserved after agglomeration (Fig. 22). The second approach is called
the 2D approach where a 2D population balance equation that considers particle
volume and area as internal coordinates was set up. Therein both particle volume
and surface area are conserved upon agglomeration. However, modeling the growth
rate of the surface was not as straightforward as the increase of volume by additive
agglomeration. The third method they studied was a Monte Carlo based, highly accurate, but also very computationally expensive method that was previously published
by Briesen [41] and adapted for the agglomeration of octahedral potash alum crystals
in Kovaˇ cevi´ c and Briesen [3]. It describes agglomerates with their full morphological
complexity and was therefore able to accurately describe both the volume and surface area of agglomerates (Fig. 23). This was made possible by using the appropriate
functionality of the MATLAB framework of Reinhold [42] and the cdd library [43].
This complex method was also used to parametrize the 2D approach.
The complex approach considers a sample number of crystals that was assumed
to be representative for the whole population that was to be simulated. It was computationally expensive to calculate the volume of the agglomerates, which makes the
method infeasible for simulations of long process times [3].
Fig. 23 Aggregation following the complex approach: The agglomerate is described with its full
geometric complexity. (Reprinted with permission from [6], Copyright (2019) American Institute
of Chemical Engineers)