

13 Morphological Modelling and Simulation …
459
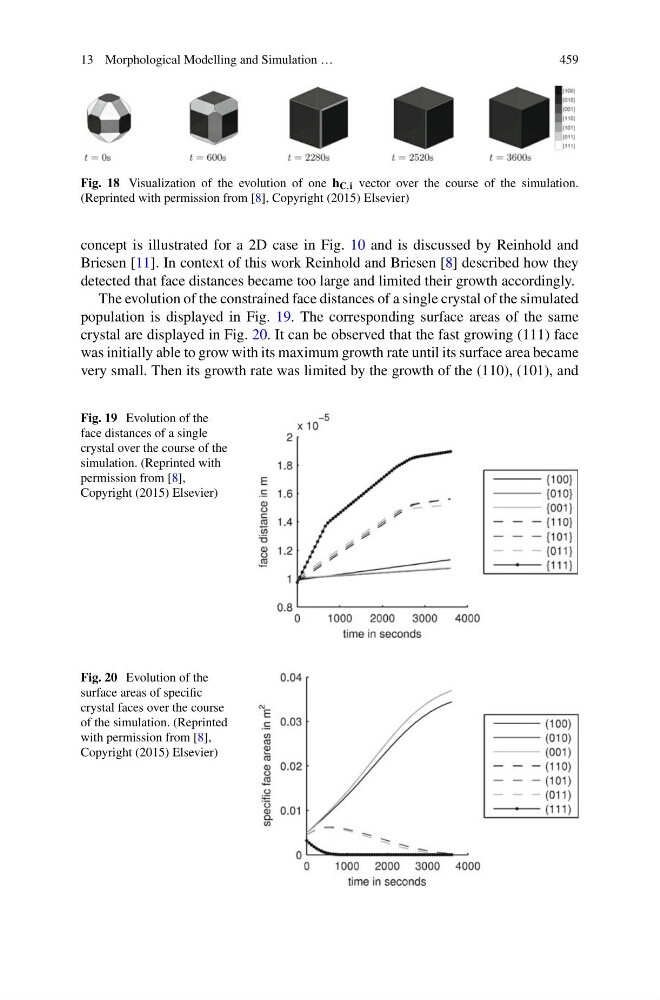
Fig. 18 Visualization of the evolution of one h C,i vector over the course of the simulation.
(Reprinted with permission from [8], Copyright (2015) Elsevier)
concept is illustrated for a 2D case in Fig. 10 and is discussed by Reinhold and
Briesen [11]. In context of this work Reinhold and Briesen [8] described how they
detected that face distances became too large and limited their growth accordingly.
The evolution of the constrained face distances of a single crystal of the simulated
population is displayed in Fig. 19. The corresponding surface areas of the same
crystal are displayed in Fig. 20. It can be observed that the fast growing (111) face
was initially able to grow with its maximum growth rate until its surface area became
very small. Then its growth rate was limited by the growth of the (110), (101), and
Fig. 19 Evolution of the
face distances of a single
crystal over the course of the
simulation. (Reprinted with
permission from [8],
Copyright (2015) Elsevier)
Fig. 20 Evolution of the
surface areas of specific
crystal faces over the course
of the simulation. (Reprinted
with permission from [8],
Copyright (2015) Elsevier)
459
Fig. 18 Visualization of the evolution of one h C,i vector over the course of the simulation.
(Reprinted with permission from [8], Copyright (2015) Elsevier)
concept is illustrated for a 2D case in Fig. 10 and is discussed by Reinhold and
Briesen [11]. In context of this work Reinhold and Briesen [8] described how they
detected that face distances became too large and limited their growth accordingly.
The evolution of the constrained face distances of a single crystal of the simulated
population is displayed in Fig. 19. The corresponding surface areas of the same
crystal are displayed in Fig. 20. It can be observed that the fast growing (111) face
was initially able to grow with its maximum growth rate until its surface area became
very small. Then its growth rate was limited by the growth of the (110), (101), and
Fig. 19 Evolution of the
face distances of a single
crystal over the course of the
simulation. (Reprinted with
permission from [8],
Copyright (2015) Elsevier)
Fig. 20 Evolution of the
surface areas of specific
crystal faces over the course
of the simulation. (Reprinted
with permission from [8],
Copyright (2015) Elsevier)